Content
Published:
This is an archived release.
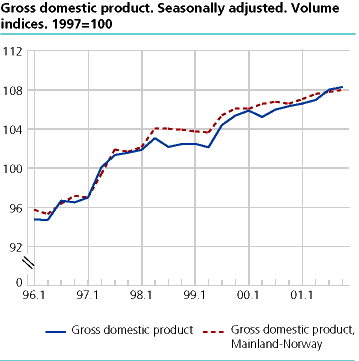
Slow growth in GDP for Mainland-Norway
Preliminary figures from the quarterly national accounts indicate slow growth in GDP for Mainland-Norway in the second half of 2001. The annual growth for the calendar year was calculated at 1.0 per cent. The annual growth for 2000 was earlier published as 1.8 per cent.
It should be noted that the growth in 2001 would have been higher and the growth in 2000 lower if there had not been irregular rainfall conditions in the fall of 2000 enabling increased power production that year.
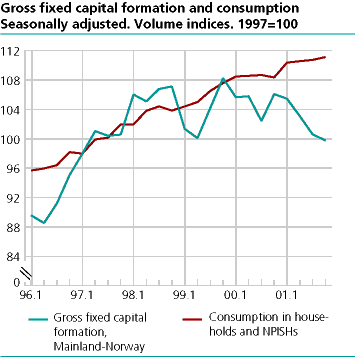
Minor change in the annual growth for consumption among households and NPISHs
The calendar year's growth was calculated at 2.2 per cent for consumption by households and NPISH's. This is approximately the same growth as recorded for the year 2000. According to the seasonally adjusted quarterly figures, the growth throughout the year was erratic. The figures indicate growth of 1.9 per cent from the 4 t h quarter 2000 to the 1 s t quarter 2001. In the successive quarters, quarterly growth (growth since the previous quarter in the seasonally adjusted figures) was more moderate. The quarterly growth in the 3 r d and 4 t h quarters was calculated at 0.2 and 0.3 per cent respectively. Some of the 1 s t quarter increase in consumption expenditure was due to high electricity usage caused by unusually cold weather. The reduction in the petrol taxes starting January 1 2001 could also have influenced the growth rates in the same period. As for the consumption expenditure in general government, the annual growth was calculated at 1.5 per cent, which is marginally higher than calculated for the year 2000.
Lower investments for Mainland - Norway for 2001
According to the seasonally adjusted figures, the trend of decrease in investment for Mainland - Norway continued in the 4 t h quarter. For the calendar year 2001, investment activity decreased 2.7 per cent from the year before. The corresponding annual growth rates for 1999 and 2000 were respectively -2.6 and 1.4 per cent. For the manufacturing industries, the annual growth last year was calculated as 8.0 per cent, while for the years 1999 and 2000 it was calculated as decreases in investments equal to 23.2 and 8.1 per cent.
A pronounced 4 t h quarter increase in investment activity within oil and gas industries aided in holding the decrease at 3.1 per cent for the year. 1999 and 2000 were calculated as decreases of 19.9 and 17.1 per cent.
Increased yearly growth in export of traditional goods in 2001
The 2001 annual growth for the export of traditional goods was calculated at 3.0 per cent, while the corresponding growth rates for 1999 and 2000 were earlier calculated as respectively 3.2 and 2.1 per cent. The figures for 2001 indicate clear growth in the export of raw chemical materials, metals, machinery and other equipment. Some of the increased growth in export might be attributed metals that were actually exported in the 4 t h quarter of 2000 were mistakenly recorded in the statistics base as exported in the 1 s t quarter of 2001.The seasonally adjusted figures indicate slower growth in the export of traditional goods for the second half of the year than the first. The quarterly growth rates in the 3 r d and 4 t h quarters of 2001 were calculated respectively as -5.6 and 2.4 per cent.
The annual growth in the export volume of crude oil and natural gas was calculated as 7.3 per cent, while the growth in 1999 and 2000 was previously published as -0.1 and 6.4 per cent. The export figures for the 4 t h quarter show relatively strong growth. A slower growth in calculated production of crude oil in the same quarter lead to reduced stocks for this quarter. The annual growth in the import of traditional goods was in 2001 calculated to be 3.1 per cent. The corresponding growth rates for 1999 and 2000 were -1.3 and 1.7 per cent respectively.
Continued production decrease in the manufacturing industries
Weak growth both in the manufacturing industries and in the service industry not including general government, lead to the relatively weak growth in Gross Domestic Product for Mainland-Norway in the second half of the year. The preliminary figures show a quarterly growth of 0.2 per cent for both the 3 r d and 4 t h quarters. For the calendar year 2001, value added for manufacturing industries decreased 1.3 per cent, while the earlier published figures showed a decrease of 3.2 per cent in 1999 and 2.7 per cent in 2000. The annual growth in value added for power supply was calculated as 16.8 per cent for 2000. If one subtracts value added for the power industry from the estimated GDP for Mainland-Norway in the three years 1999-2001, one can calculate how GDP for Mainland-Norway would have developed if it had not been influenced by the irregular rainfall situation in 2000. The annual growth in the GDP for Mainland-Norway excluding the power industry shows a growth of 1.4 per cent in 2000 and a growth 1.3 per cent in 2001.
Minimal change in annual growth in total employed persons from 2000
For 2001, the annual growth in the number of employed persons was calculated as 0.4 per cent. This is approximately the same growth calculated for 2000. According to the 2001 preliminary figures, a large portion of the recorded growth in the number of employed persons was attributed to increased job placement within the local municipal sector. For the manufacturing industries, a decrease of 1.7 per cent was calculated. Total hours worked showed a decrease of 0.8 per cent for the calendar year. This decrease should be considered in light of the introduction of two extra vacation days for most employees and the factor that the year 2001 had fewer working days than 2000. The annual growth in compensation per full-time equivalent persons has been calculated at 4.9 per cent in 2001. Corresponding growth for 1999 and 2000, were earlier published as respectively 5.3 and 4.3 per cent.
Slow growth in operating surplus for Mainland - Norway
The preliminary figures from the quarterly national accounts estimate the total operating surplus for mainland economy at 151 billion kroner (current kroner value). This in an increase of only 1 billion from 2000. For Mainland-Norway, total employee compensation costs rose 38 billion since 2000, which is equal to a growth of 6.3 per cent.
Lower disposable income in 2001
Preliminary calculations show a slight reduction in disposable income for Norway compared with figures from 2000. Disposable income is a measure of the income that the country has at disposal for consumption and savings. The reduction in disposable income is primarily a result of the decreased prices on crude oil and natural gas in 2001. The decrease in disposable income contributed to the somewhat lower estimate of total savings, defined as disposable income minus total consumption. The savings rate, defined as the total savings as a percentage of disposable income, was reduced from 26 per cent in 2000 to 24 per cent in 2001.
| Gross domestic product 1. to 4. quarter 2001. Percentage change in volume from the previous period (seasonally adjusted) |
| 1999 | 2000 | 2001 | 1. quarter 2001 | 2. quarter 2001 | 3. quarter 2001 | 4. quarter 2001 | |||||||||||||||||||||||||||||||||
|---|---|---|---|---|---|---|---|---|---|---|---|---|---|---|---|---|---|---|---|---|---|---|---|---|---|---|---|---|---|---|---|---|---|---|---|---|---|---|---|
| Gross domestic product (GDP) | 1,1 | 2,3 | 1,4 | 0,3 | 0,3 | 1,0 | 0,2 | ||||||||||||||||||||||||||||||||
| Mainland Norway | 1,0 | 1,8 | 1,0 | 0,5 | 0,5 | 0,2 | 0,2 | ||||||||||||||||||||||||||||||||
| Petroleum activities and ocean transport | 1,4 | 4,4 | 3,7 | -0,6 | -0,3 | 4,7 | 0,4 | ||||||||||||||||||||||||||||||||
| Final domestic use of goods and services | -0,7 | 2,2 | -0,6 | 0,9 | 0,3 | -0,1 | 1,2 | ||||||||||||||||||||||||||||||||
| Final consumption exp. of households and NPISHs | 2,2 | 2,4 | 2,2 | 1,9 | 0,2 | 0,2 | 0,3 | ||||||||||||||||||||||||||||||||
| Final consumption exp of general government | 3,3 | 1,4 | 1,5 | -0,1 | 0,5 | 0,5 | 1,1 | ||||||||||||||||||||||||||||||||
| Gross fixed capital formation | -8,2 | -1,1 | -5,9 | 3,6 | -6,6 | -2,4 | 11,3 | ||||||||||||||||||||||||||||||||
| Exports | 2,8 | 2,7 | 5,3 | 1,4 | -1,4 | 1,7 | 1,0 | ||||||||||||||||||||||||||||||||
| Imports | -1,6 | 2,5 | 0,3 | 3,6 | -2,0 | -1,0 | 3,9 | ||||||||||||||||||||||||||||||||
| Total employed, employees and self-employed | 0,6 | 0,5 | 0,4 | 0,6 | 0,2 | 0,1 | 0,6 | ||||||||||||||||||||||||||||||||
Inaccuracies in the calculations
With use of these figures, one must take into consideration that the results from the quarterly national accounts are built upon calculations where the ground material is of varying quality. Specifically, information from the 4 t h quarter is of indeterminable quality since the ground material is more limited than for the other quarters.
Tables
Contact
-
Pål Sletten
E-mail: pal.sletten@ssb.no
tel.: (+47) 99 29 06 84
-
Ingunn Sagelvmo
E-mail: ingunn.sagelvmo@ssb.no
tel.: (+47) 40 90 26 32
-
Pia Tønjum
E-mail: pia.tonjum@ssb.no
tel.: (+47) 48 99 12 07
-
Kristian Gimming
E-mail: kristian.gimming@ssb.no
tel.: (+47) 91 88 39 06