Content
Published:
This is an archived release.
Health expenditure accounts for more than 10 per cent of GDP
Preliminary figures show that Norway’s current health expenditure was NOK 326 billion in 2016. Measured per capita, the health expenditure is about NOK 62 000; an increase of NOK 2 000 from 2015.
| 2013 | 2014 | 2015 | 2016 | |
|---|---|---|---|---|
| 1Figures for the two last years are preliminary. | ||||
| 2Current health expenditure does not include capital formation | ||||
| Current expenditure on health | 274 246 | 293 507 | 310 981 | 325 615 |
| Volume growth from previous year | 0.9 | 2.0 | 2.1 | 2.5 |
| Capital formation in health care institutions. NOK million | 18 487 | 20 924 | 18 793 | 19 949 |
| Current expenditure on health. Per cent of GDP | 8.9 | 9.3 | 10.0 | 10.5 |
| Current expenditure on health. Per cent of GDP Mainland Norway | 11.3 | 11.6 | 11.9 | 12.0 |
| Current health expenditure per capita | 53 984 | 57 131 | 59 921 | 62 186 |
| Health expenditure per capita. Volume growth from previous year. | -0.3 | 0.8 | 1.1 | 1.6 |


Health expenditure per capita was more than NOK 62 000 in 2016. The health expenditure per capita adjusted for inflation grew by 1.6 per cent from 2015 to 2016. Since 2013, the health expenditure per capita has grown by an annual average of 1.2 per cent.
Norway’s health expenditure as a share of GDP is increasing
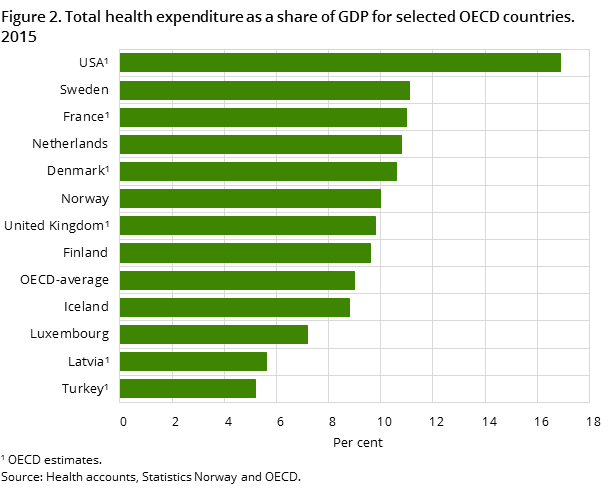
There are large variations in the level and growth of health spending across the OECD. Health expenditure as a share of GDP is often used in international comparisons of health spending. In 2016, the health expenditure in Norway accounted for 10.5 per cent of GDP; an increase from 10.0 per cent in 2015. According to the latest available OECD figures, the average in the OECD countries was 9.0 per cent in 2015. Among the OECD countries, the USA has the highest share, with 16.9 per cent, and Turkey has the lowest share at 5.2 per cent.
In 2015, the health spending to GDP ratio in the Nordic countries ranged between 8.8 per cent for Iceland and 11.1 per cent for Sweden. If these ratios are similar in 2016, Norwegian health spending is on a par with the other Nordic countries when measured as a share of GDP in both 2015 and 2016.
Norway’s health spending to GDP ratio has been increasing in recent years. In 2013 and 2014, the ratio was 8.9 and 9.4 per cent respectively. The increase in the ratio should be seen in the context of the developments in the rest of the economy. Due to the fall in the oil prices, the GDP level sunk in both 2015 and 2016. As health spending shows a more stable increase, health spending as a GDP ratio will also increase. To remove the effect of fluctuations in oil and gas prices, we often look at health spending as a share of GDP for mainland Norway. This share has also been increasing, though more modestly, with 12.0 per cent in 2016, 11.9 per cent in 2015 and 11.6 per cent in 2014.
The public sector covers most of the health spending
The share of public financing of the current health expenditure varies between countries. In recent years, about 85 per cent of the health expenditure in Norway has been financed by the public sector. In 2016, the estimated public financing was about NOK 277 billion, which corresponds to 85.2 per cent of the health expenditure. This share is above the 2014 EU average of 79.0 per cent and the OECD 2015 average of 72.9 per cent. All Nordic countries have a relative public financing share that is above the OECD average.
The share of public financing also varies between the different types of health care services. For dental services, the share is as low as 30 per cent. Inpatient curative care, on the other hand, is almost completely publicly funded.
Investments remain high in 2016
The investment estimate for 2016 is NOK 20 billion. In 2015 and 2016, the investments were NOK 19 billion and NOK 21 billion respectively. There are several projects that still attract large investments. The investments of NOK 20 billion include NOK 4 billion in research and development.
Volume growth in national figures differs from OECD estimateOpen and readClose
The volume growth in our national figures may differ from the growth estimated by the OECD in the publication “Health at a Glance”. This is because the OECD uses a method where the total health spending figures are deflated using an economy-wide GDP deflator. In the Norwegian figures, the volume growth is calculated according to the national accounts method, meaning that many different but relevant price indices are used or that the volume changes are observed directly. An example of the latter is the hospitals’ DRG system, which can have information on the volume of hospital services.
Contact
-
Eirik Larsen Lindstrøm
E-mail: eirik.lindstrom@ssb.no
tel.: (+47) 46 78 22 92
