Content
Published:
This is an archived release.
NOK 60 000 spent on health per capita
Preliminary estimates from the health accounts show that the current health expenditure amounted to NOK 311 billion in 2015. This corresponds to NOK 60 000 per capita. The health expenditure per capita increased by 1.1 per cent from the previous year.
| 2012 | 2013 | 2014 | 2015 | |
|---|---|---|---|---|
| 1Figures for the final year are preliminary. | ||||
| 2Current health expenditure does not include capital formation | ||||
| Corrected 17 October 2016. | ||||
| Current expenditure on health | 260 182 | 274 246 | 293 507 | 310 981 |
| Volume growth from previous year | 0.9 | 2.0 | 2.1 | |
| Capital formation in health care institutions. NOK million | 14 458 | 18 487 | 20 924 | 18 793 |
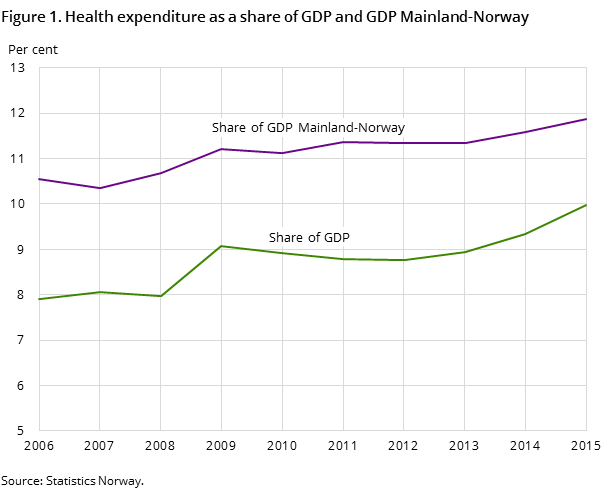
| Current expenditure on health. Per cent of GDP | 8.8 | 8.9 | 9.3 | 10.0 |
| Current expenditure on health. Per cent of GDP Mainland Norway | 11.3 | 11.3 | 11.6 | 11.9 |
| Current health expenditure per capita | 51 844 | 53 984 | 57 131 | 59 921 |


Measured per capita, the health expenditure has increased from 50 000 in 2011 to 60 000 in 2015. Adjusted for inflation, the health expenditure per capita has grown by an average 0.7 per cent per year during this period.
Health spending accounts for 10 per cent of GDP
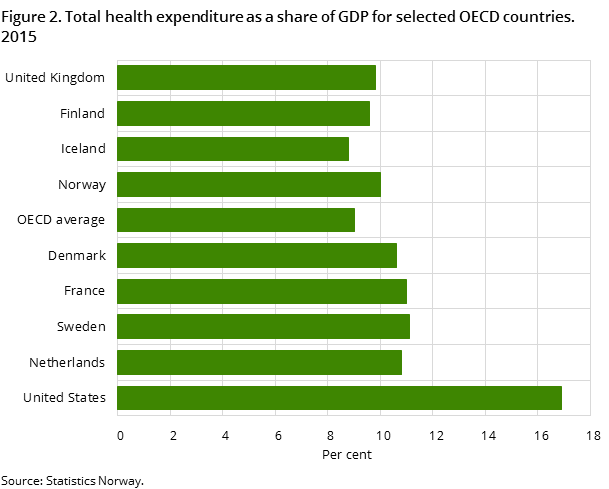
Health expenditure as a share of GDP is often used in international comparisons of health spending. In 2015, the health expenditure in Norway accounted for 10.0 per cent of GDP. By comparison, the average in the OECD countries was 9.0 per cent in the same year. Among the OECD countries, the USA has the highest share, with 16.9 per cent. In Turkey and Latvia, the shares are 5.2 and 5.6 per cent respectively.
In the Nordic countries, the health spending to GDP ratio ranges between 8.8 per cent for Iceland and 11.1 per cent for Sweden. Hence, Norwegian health spending is on a par with the other Nordic countries when measured as a share of GDP. Another common way of comparing health spending is to look at health expenditure per capita measured in USD PPP. This means that the per capita health expenditures are converted to a common currency, and adjusted to take into account differences in purchasing power. If we look at this figure, Norway spends the most on health of all the Nordic countries.
Curative and rehabilitative care services account for half of health spending
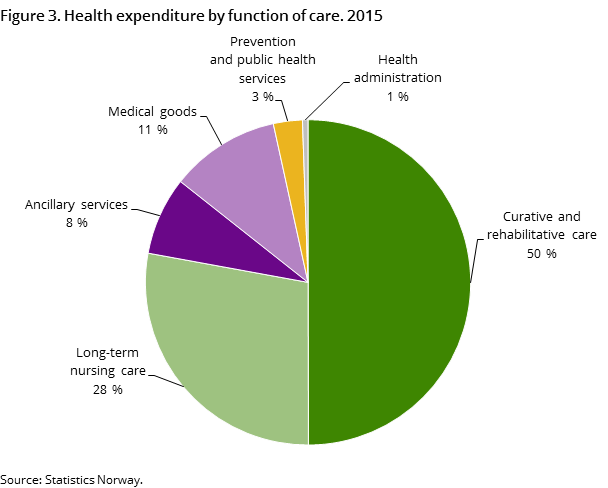
Services of curative and rehabilitative care, which include hospital services, GP services, dental care and physiotherapy account for the largest share of the total health expenditure. In 2015, these services accounted for almost 50 per cent of the total health expenditure in Norway.
Health-related long-term care services accounted for 28 per cent of the total health expenditure. Compared with other countries in the OECD, Norway has a high share of spending on these health services. In general, the Nordic countries spend a lot on long-term care services because they have established formal arrangements for the elderly and dependent population.
The public sector covers 85 per cent of health spending
In 2015, the public sector financed 85.4 per cent of the current health expenditure. In recent years, the share of public financing in Norway has remained stable at around 85 per cent. The share of public financing varies between the different types of health care services. For dental services, the share is as low as 30 per cent. Inpatient curative care, on the other hand, is almost completely publicly funded.
Gross capital formation NOK 19 billion in 2015
In 2015, the gross capital formation amounted to about NOK 19 billion. This is a slight decrease from the previous year, where investments amounted to about NOK 21 billion.
Volume growth in national figures differs from OECD estimateOpen and readClose
The volume growth in our national figures may differ from the growth estimated by the OECD in the publication “Health at a Glance”. This is because the OECD uses a method where the total health spending figures are deflated using an economy-wide GDP deflator. In the Norwegian figures, the volume growth is calculated according to the national accounts method, meaning that many different but relevant price indices are used or that the volume changes are observed directly. An example of the latter is the hospitals’ DRG system, which can have information on the volume of hospital services.
Contact
-
Eirik Larsen Lindstrøm
E-mail: eirik.lindstrom@ssb.no
tel.: (+47) 46 78 22 92
