Content
Published:
This is an archived release.
One out of nine invested in farm buildings
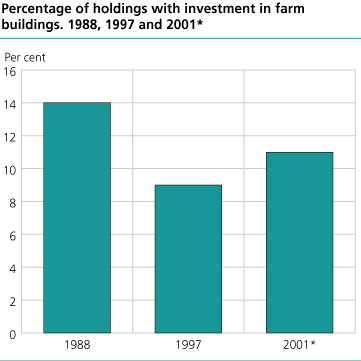
Investments in farm buildings amounted to NOK 1.25 billion in 2001. About 6 900, or 11 per cent of the holdings invested in farm buildings.
Investments in farm buildings made NOK 1.25 billion in 2001. The corresponding figures for 1988 and 1997 were NOK 2.37 and 1.44 billion. The amounts for 1988 and 1997 are converted to "2001 kroner" by the Consumer Price Index. The percentage of holdings with investment in farm buildings decreased from 14 per cent in 1988 to 9 per cent in 1997 and then increased slightly to 11 per cent in 2001. Average investments per holding with investment in 2001 were NOK 181 300. It was the youngest holders and those operating much agricultural area that made the greatest investments.
About 60 per cent of the holdings had maintenance expenditures in 2001. The expenditures made up NOK 738 million, which is NOK 19 700 per holding with maintenance.
Slight increase in investments in machinery and implements
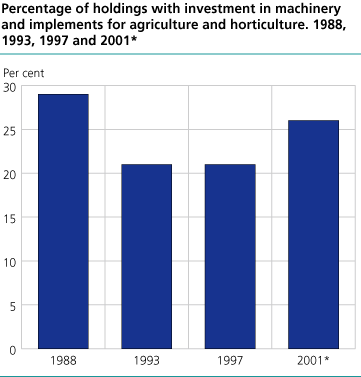
Investments in machinery and implements for agriculture and horticulture made NOK 2.43 billion in 2001. About 16 100, or 26 per cent of the holdings, invested in new or second-hand machinery and implements. Comparable figures for 1993 and 1997 show that only 21 per cent of the holdings made this kind of investment, while the percentage was 29 in 1988. Total investments in 1988, 1993 and 1997 were NOK 3.11 billion, 1.98 billion and 2.33 billion respectively. Again the amounts are converted to "2001 kroner" by the Consumer Price Index. Average investments per holding with investments in 2001 were NOK 150 900.
Consumption of electricity was 24 000 kWh per holding
Total consumption of electricity in agriculture and horticulture was 1.26 million kWh in 2001. The figure for 1993 was 1.23 million kWh.In 2001 the average consumption per holding was 24 000 kWh, while in 1993 it was 17 000 kWh. In 2001 the consumption of diesel was 118 million litres, which is 2200 litres per holding.
Tables:
- Table 1 Holdings with investment in farm buildings. 1988, 1997 and 2001*
- Table 2 Investment in farm buildings. 1988, 1997 and 2001*
- Table 3 Maintenance of farm buildings. 2001*
- Table 4 Holdings with investment in machinery and implements for agriculture and horticulture. 1988, 1993, 1997 and 2001*
- Table 5 Investment in machinery and implements for agriculture and horticulture. 1988, 1993, 1997 and 2001*
- Table 6 Consumption of electricity in agriculture and horticulture. 1993, 2001* and 2002*
- Table 7 Consumption of diesel in agriculture and horticulture. 2001*
Contact
-
Berit Bjørlo
E-mail: berit.bjorlo@ssb.no
tel.: (+47) 40 81 13 76
-
Cathrine Gran Øverby
E-mail: cathrine.overby@ssb.no
tel.: (+47) 40 85 46 03


