Content
Published:
This is an archived release.
Minor change in felled moose
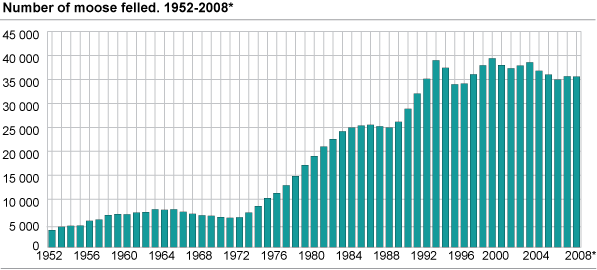
A total of 35 600 moose were felled during the 2008/09 hunting season; a decrease of 50 animals from the previous year.
Out of a felling quota of 43 897 animals, 81 per cent were felled. In the 2007/08 season, the felling quota was 44 274, of which 80 per cent were felled. The felling ratio shows how many animals are shot as a percentage of the number of licences issued. Since 1992, the felling ratio at country level has fallen gradually from 89 per cent.
Most moose felled in Hedmark
Hedmark is the largest "moose county" in terms of the number of licences and animals felled. A total of 8 621 hunting licences were issued and 7 981 animals were felled, resulting in a felling ratio of 93. The number of felled moose in Hedmark has not been higher since the record year of 1992. In the counties of Nord-Trøndelag and Buskerud, 4 888 and 3 099 moose were felled respectively.
Number of moose hunters
Among the cervid species, moose hunting is the most common. A total of 57 200 hunters participated in the moose hunt in the hunting year of 2007/08.
Changed reporting unit from the hunting year 2007/08As from the hunting year 2007/08, The Directorate for Nature Management has decided that reporting at municipality level shall be based on the hunting area for which the municipality is responsible for the administration. In previous years, the figures were based on the hunting area within the municipality. This results in a break in time series for the statistics. Figures are not comparable for municipalities managing only a part of the hunting area themselves and for municipalities managing areas in other municipalities. Municipalities not managing any hunting area themselves will not be included in the statistics. Since the municipality figures are not comparable from one year to another, the statistics from now on will only be published down to county level. |
Tables:
Contact
-
Terje Olav Rundtom
E-mail: terje.olav.rundtom@ssb.no
tel.: (+47) 91 38 60 61
-
Anne Turi Baklien
E-mail: anne.turi.baklien@ssb.no
tel.: (+47) 48 24 45 30


