Content
Published:
This is an archived release.
Increase in felled moose
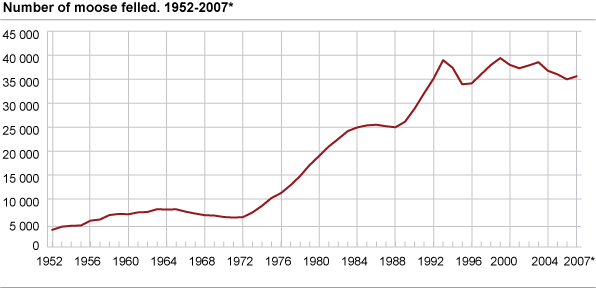
35 600 moose were felled during the 2007/08 hunting year, an increase of 600 animals from the previous year.
Out of a felling quota of 44 274 animals, 80 per cent were felled. In the 2006/07 season, the felling quota was 44 460, of which 79 per cent were felled. The felling ratio shows how many animals are shot as a percentage of the number of licences issued. Since 1992, the felling ratio on country level has fallen gradually from 89 per cent.
Most moose felled in Hedmark
Hedmark is the largest "moose county" in terms of the number of licenses and animals felled. 8 513 hunting licences were issued, and 7 868 animals were felled, resulting in a felling ratio of 92. In the counties of Nord-Trøndelag and Telemark, 4 926 and 3 047 moose were felled respectively.
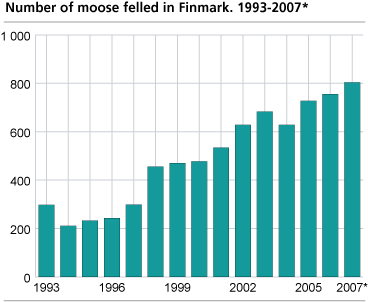
Over the past years, the yield has increased in Finnmark as a result of increasing numbers of moose in the north of Norway. Since 1993, the number of moose felled has increased from 298 to 804.
Number of moose hunters
Among the cervid species, moose hunting is most common. A total of 57 400 hunters participated in the moose hunt in autumn 2006.
Changed reporting unit from 2007/08As of the 2007/08 hunting year, figures on municipality level are based on the hunting area which the municipality is administratively responsible for. In previous years, the figures were based on the hunting area in the municipality. This results in breaks in the time series for the statistics. The figures are not comparable for municipalities that only manage a part of the hunting area themselves and for municipalities that manage areas in other municipalities. Municipalities that do not manage any hunting areas themselves will not be included in the statistics. |
Tables:
Contact
-
Terje Olav Rundtom
E-mail: terje.olav.rundtom@ssb.no
tel.: (+47) 91 38 60 61
-
Anne Turi Baklien
E-mail: anne.turi.baklien@ssb.no
tel.: (+47) 48 24 45 30


