Record high first-hand value of salmon
Published:
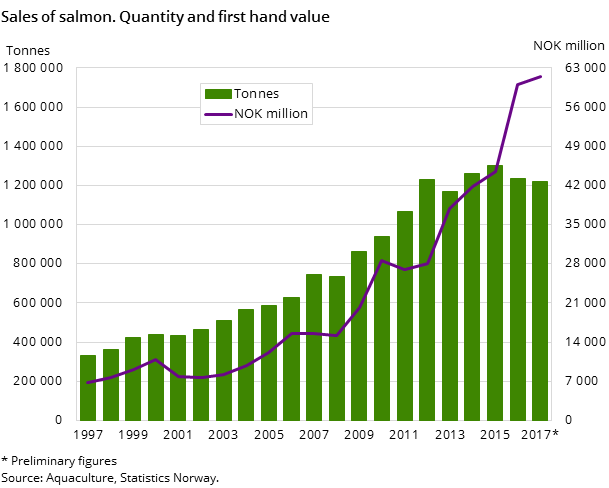
In 2017, the first-hand value of Norwegian farmed salmon came to NOK 61.4 billion. This is more than double that of five years ago, and up 2 per cent from the previous year.
- Full set of figures
- Aquaculture (terminated in Statistics Norway)
- Series archive
- Aquaculture (archive)
According to preliminary figures for Aquaculture, the total production of Norwegian farming of fish and shellfish was 1.3 million tonnes in 2017, corresponding to a first-hand value of NOK 64.7 billion. This is a decrease of 3 per cent for sold quantity and an increase of 1 per cent for first-hand value.
Rise in sale prices of salmon
Salmon was the main product both in terms of quantity and value. The first-hand value of farmed salmon was NOK 61.4 billion in 2017. This is 2 per cent higher than the year before, and a new record high for farmed salmon. In the same period, the quantity sold fell 1 per cent, giving a total of 1.22 million tonnes. The average price per kilo for salmon was NOK 50.35, an increase of 3 per cent from the previous year.
Less production of trout
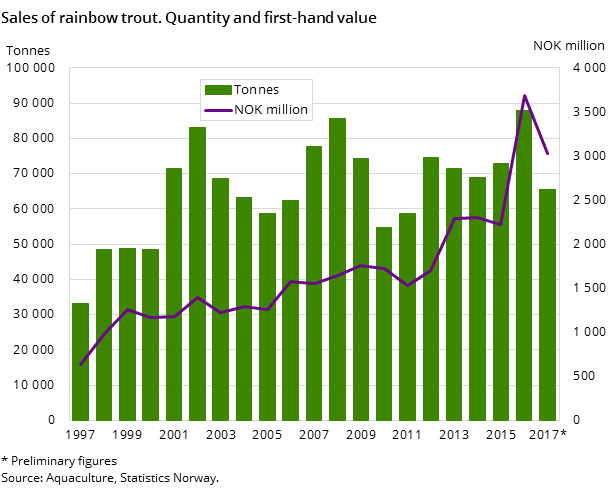
A total of 65 400 tonnes of farmed trout was sold in 2017, corresponding to a first-hand value of NOK 3.0 billion. This is a decrease of 26 per cent for quantity sold and 18 per cent for value. The average price per kilo increased by 10 per cent, to NOK 46.31 in 2017.
Shellfish and other species worth NOK 261 million
Shellfish and species other than salmon and trout account for a small part of Norwegian fish farming. Of these species, 5 100 tonnes worth NOK 261 million was produced in 2017. In this group of species, shellfish accounted for 47 per cent of produced quantity and 12 per cent of first-hand value.
Figure 3. Sales of other fish species. Quantity
| Cod | Char | Halibut | |
| 1997 | 304 | 350 | 113 |
| 1998 | 199 | 190 | 290 |
| 1999 | 157 | 498 | 451 |
| 2000 | 170 | 282 | 562 |
| 2001 | 535 | 317 | 377 |
| 2002 | 1258 | 319 | 424 |
| 2003 | 2185 | 272 | 426 |
| 2004 | 3165 | 324 | 648 |
| 2005 | 7409 | 352 | 1197 |
| 2006 | 11087 | 897 | 1185 |
| 2007 | 11104 | 394 | 2308 |
| 2008 | 18052 | 468 | 1587 |
| 2009 | 20924 | 421 | 1568 |
| 2010 | 21240 | 492 | 1610 |
| 2011 | 15273 | 276 | 2767 |
| 2012 | 10033 | 309 | 1740 |
| 2013 | 3770 | 1385 | |
| 2014 | 1386 | 1257 | |
| 2015 | 260 | 1244 | |
| 2016 | 333 | 1460 | |
| 2017* | 365 | 1623 |
Contact
-
Anne Turi Baklien
-
Trond Amund Steinset
-
Statistics Norway's Information Centre


