Content
Published:
This is an archived release.
Increase in hospital man-years
Preliminary figures show an increase in man-years in hospitals by 3.3 per cent at the end of 2002, or just below 2 000 extra man years.
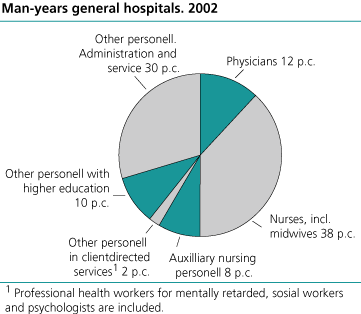
61 400 man-years were attached to general hospitals at the end of 2002. This is an increase of almost 3,3 percent, or 2 000 extra man-years. The increase is more than two times as big as the growth from 2000 until 2001, when the growth in hospital man-years was 1.5 per cent. If we look at the total man-years for all institutions in specialist health service for somatic care the growth is less. Some of the increase in the hospitals might be a result of the reorganization within national administration of the specialist health service.
IMore nurses
Physician man-years increased around 1 per cent from 2001 until 2002. Following the trend the last years the number of nurses have increased. The number of auxiliary nurses, that have had a gradually decrease since 1993, also had a little growth in 2002. Preliminary figures show 900 more man-years for nurses in 2002 compared to the year before, and we have to go back to 1998 to find a corresponding growth. Totally there are almost 22 250 nurses and around 5 130 auxiliary nurses at the hospitals in 2002.
If we look at the total man-years within general hospitals for the last ten years there have been a gradually increase of almost 30 per cent, and the figures for 2002 following the trend.
Table 3 shows the number of man-years divided on the five health regions in Norway, and gives the number of employees in the different regions.
More beds in hospitals
At the end of 2002, preliminary figures show an increase in the total number of beds. Number of beds are 14 172, and this is 227 more beds compared to 2001. In 2001, the number of beds was unchanged compared to 2000. There have been a gradually decrease in the number of beds from 1990 until 2000, and the decline was 13 per cent in this period. In 2002, some hospitals have extended their bed capacity, while other have reduced their bed capacity.
In-patient stays and day cases
Around 741 000 patients were discharged from hospitals in 2002, an increase of 2.7 per cent, or 19 500 more discharges, compared to 2001. Since 1990 the amount of discharges has increased by almost 21 per cent, or 128 300 discharges. Over 3,4 million day treatments were carried out in hospitals in 2002.
Number of hospitals
The official number of hospitals in Norway year 2002 is 74. Some of these hospitals consist of several hospital units, but report as one hospital.
For further information, see:
Patient statistics
.
Specialist health service, accounts .
| Key figures for general hospitals. 1990-2002 |
| 1990 | 1995 | 2000 | 2001 | 2002 | |||||||||||||||||||||||||||||||||||
|---|---|---|---|---|---|---|---|---|---|---|---|---|---|---|---|---|---|---|---|---|---|---|---|---|---|---|---|---|---|---|---|---|---|---|---|---|---|---|---|
| Beds | 16 040 | 14 534 | 13 944 | 13 945 | 14 172 | ||||||||||||||||||||||||||||||||||
| Discharges | 612 724 | 638 557 | 691 974 | 721 458 | 741 051 | ||||||||||||||||||||||||||||||||||
| Bed-days in 1 000 | 4 507 | 4 240 | 4 154 | 4 193 | 4 192 | ||||||||||||||||||||||||||||||||||
| Out-patient consultations in 1 000 | 2 547 | 3 033 | 3 591 | 3 582 | 3 404 | ||||||||||||||||||||||||||||||||||
| Man-years1, total | 46 508 | 50 130 | 58 522 | 59 406 | 61 400 | ||||||||||||||||||||||||||||||||||
| Man-years1, physicians | 4 576 | 5 402 | 7 073 | 7 242 | 7 306 | ||||||||||||||||||||||||||||||||||
| Man-years1, nurses and midwives | 15 614 | 18 457 | 22 343 | 22 518 | 22 248 | ||||||||||||||||||||||||||||||||||
| Man-years1, high-school educated personnel2 | 3 802 | 4 542 | 5 615 | 5 867 | 5 950 | ||||||||||||||||||||||||||||||||||
| Man-years1, auxiliary nursing personnel | 6 629 | 5 536 | 5 216 | 5 075 | 5 134 | ||||||||||||||||||||||||||||||||||
| Man-years1, other occupational therapists | 689 | 516 | 772 | 854 | 1 011 | ||||||||||||||||||||||||||||||||||
| Man-years1, administration and service | 14 974 | 15 420 | 17 170 | 17 507 | 18 203 | ||||||||||||||||||||||||||||||||||
| 1 |
Man-years is the number of full-time employees and part-time employees (converted to
full-time employees) at the end of the year. Overtime is not included. |
| 2 | Physiotherapists, medical laboratory technicians, radiographers and occupational therapsits. |
Tables:
- Table 1 Number of calculated man-years in general (somatic) institutions, by category of personnel. 1993-2002
- Table 2 Number of calculated man-years in general (somatic) hospitals, by category of personnel. 1990-2002
- Table 3 Number of calculated man-years in general hospitals, per health region and by category of personnel. 2002
The statistics is published with Specialist health service.
Contact
-
Statistics Norway's Information Centre
E-mail: informasjon@ssb.no
tel.: (+47) 21 09 46 42