Content
Published:
This is an archived release.
Increase in hospital activities
General hospitals treated almost 3 600 000 outpatients in2001. Inpatient stays increased by 4 per cent. Approximately 721 500 patients were discharged during the year.
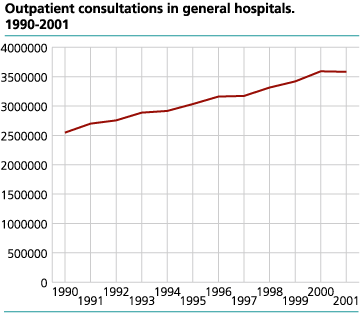
From 1990 to 2001, the number of outpatient treatments increased by 40 per cent. In 2001 almost 3.6 million patients were treated. Compared with the number of outpatient treatments in 2000 it looks like the number of these treatments has declined. However, changes in two counties due to registration are the reason for this. In most of the counties an increase in the number of outpatient treatments in 2001 has occurred.
Fewer beds - but increase in inpatient stays
While the number of outpatient treatments increased, there was a gradual decline in the number of beds. If we look at the period from 1990 to 2000 the number of beds declined by 13 per cent. In 2001, the number of beds in general hospitals was almost the same as in 2000. The number of beds was 13 945. That is on average 3 beds per 1000 inhabitants.
Even if the number of beds remained unchanged, an increase in inpatient stays took place. Approximately 721 500 patients were discharged in 2001, a 4 per cent growth compared with 2000.
| Key figures for somatic hospitals. 1992-2001 |
| 1990 | 1995 | 2000 | 2001 | ||||||||||||||||||||||||||||||||||||
|---|---|---|---|---|---|---|---|---|---|---|---|---|---|---|---|---|---|---|---|---|---|---|---|---|---|---|---|---|---|---|---|---|---|---|---|---|---|---|---|
| Beds | 16 040 | 14 534 | 13 944 | 13 945 | |||||||||||||||||||||||||||||||||||
| Discharges | 612 724 | 638 557 | 691 974 | 721 458 | |||||||||||||||||||||||||||||||||||
| Bed-days in 1000 | 4 507 | 4 240 | 4 154 | 4 193 | |||||||||||||||||||||||||||||||||||
| Out-patient consultations in 1000 | 2 547 | 3 033 | 3 591 | 3 582 | |||||||||||||||||||||||||||||||||||
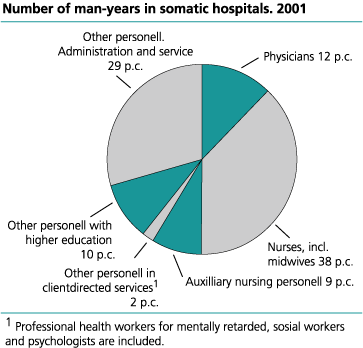
| Man-years1, total | 46 508 | 50 130 | 58 522 | 59 406 | |||||||||||||||||||||||||||||||||||
| Man-years1, physicians | 4 576 | 5 402 | 7 073 | 7 242 | |||||||||||||||||||||||||||||||||||
| Man-years1, nurses and midwives | 15 614 | 18 457 | 22 343 | 22 518 | |||||||||||||||||||||||||||||||||||
| Man-years1, high-school educated personnel2 | 3 802 | 4 542 | 5 615 | 5 867 | |||||||||||||||||||||||||||||||||||
| Man-years1, auxiliary nursing personnel | 6 629 | 5 536 | 5 216 | 5 075 | |||||||||||||||||||||||||||||||||||
| Man-years1, other occupational therapists | 689 | 516 | 772 | 854 | |||||||||||||||||||||||||||||||||||
| Man-years1, administration and service | 14 974 | 15 420 | 17 170 | 17 507 | |||||||||||||||||||||||||||||||||||
| Gross current expenses. Million kroner (corrected 25 September 2002) | 16 477 | 20 519 | 32 151 | 36 374 | |||||||||||||||||||||||||||||||||||
| 1 |
Man-years is the number of full-time employees and part-time employees (converted to full-time employees)
at the end of the year. Overtime is not included. |
| 2 | Physiotherapists, medical laboratory technicians, radiographers and occupational therapsits. |
Slight increase in man-years
Approximately 59 400 man-years were attached to general hospitals by the end of year 2000. This is an increase of 1.5 per cent compared with the previous year, or almost 900 extra man-years. If we look at the last ten years, a gradual increase in the man-years in general hospitals took place. The increase followed a trend seen during the last ten years. The increase the two last years - 2001-2000 - was the lowest since 1994.
Man-years performed by medical laboratory technicians and radiographers increased the most.
At the end of 2001 physician man-years increased approximately 2 per cent, equivalent to 169 man-years. The number of nurses had a slight increase under 1 per cent, while the number auxiliary nurses declined by 3 per cent or 141 man-years. The decline was the largest since 1994. Man-years performed by medical laboratory technicians increased 5 per cent, 143 man-years, and radiographers increased 9 per cent, 112 man-years.
Growth in hospitals expenses
The total amount of expenses within the specialist health service of somatic care was NOK 38 billion in 2001. NOK 36 billion were used to operate the general hospitals. This was an increase in the gross current expenditures of 13 per cent from 2000 to 2001. On average, gross current expenditures per inhabitants were about NOK 8000.
Tables:
- Table 1 Number of calculated man-years in general (somatic) institutions, by category of personnel. 1990-2001
- Table 2 Number of calculated man-years in general (somatic) hospitals, by category of personnel. 1980-2001
- Table 3 Number of calculated man-years in general hospitals, by category of personnel and county. 2001
- Table 4 Number of beds in general hospitals, by county. 1990-2001
- Table 5 Number of outpatient consultations in general hospitals, by county. 1990-2001
- Table 6 Discharges, by type of institution. 1990-2000
- Table 7 Number of bed-days, by type of institution. 1990-2001
- Table 8 Gross current expenses, by type of institution. 1990-2001. 1 000 kroner
- Table 9 Gross current expenses for somatic institutions, by county. 1990-2001. 1 000 kroner
The statistics is published with Specialist health service.
Contact
-
Statistics Norway's Information Centre
E-mail: informasjon@ssb.no
tel.: (+47) 21 09 46 42


