Content
Published:
This is an archived release.
Slight increase in hospital man-years
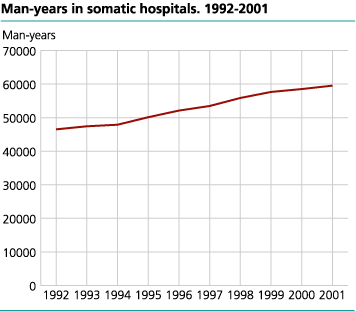
From 2000 to 2001 preliminary figures show a slight increase in man-years in general hospitals. The growth was 1.7 per cent, almost 1000 man-years. Approximately 59 500 man-years were attached to general hospitals by the end of 2000. Man-years performed by medical laboratory technicians and radiographers increased the most.
At the end of 2001 physician man-years had raised approximately 2 per cent, corresponding to 168 man-years. The number of nurses had a slight increased by 3 per cent, while auxiliary nurses had a decline of 3 per cent or 155 man-years. The decline is the largest since 1994. Man-years performed by medical laboratory technicians increased 5 per cent or 143 man-years, and radiographers increased 9 per cent or 112 man-years.
If we look at the last ten years period, there has been a gradual increase in the man-years in general hospitals. The increase is following a trend seen during the last ten years.
| Key figures for somatic hospitals 1992-2001 |
| 1990 | 1995 | 2000 | 20011 | ||||||||||||||||||||||||||||||||||||
|---|---|---|---|---|---|---|---|---|---|---|---|---|---|---|---|---|---|---|---|---|---|---|---|---|---|---|---|---|---|---|---|---|---|---|---|---|---|---|---|
| Beds | 16 040 | 14 534 | 13 944 | 13 920 | |||||||||||||||||||||||||||||||||||
| Discharges | 612 724 | 638 557 | 691 974 | 721 458 | |||||||||||||||||||||||||||||||||||
| Bed-days in 1000 | 4 507 | 4 240 | 4 154 | 4 193 | |||||||||||||||||||||||||||||||||||
| Out-patient consultations in 1000 | 2 547 | 3 033 | 3 591 | 23 503 | |||||||||||||||||||||||||||||||||||
| Man-years3, total | 46 508 | 50 130 | 58 522 | 59 530 | |||||||||||||||||||||||||||||||||||
| Man-years3, physicians | 4 576 | 5 402 | 7 073 | 7 241 | |||||||||||||||||||||||||||||||||||
| Man-years3, nurses and midwives | 15 614 | 18 457 | 22 343 | 22 501 | |||||||||||||||||||||||||||||||||||
| Man-years3, high-school educated personnel4 | 3 802 | 4 542 | 5 615 | 5 859 | |||||||||||||||||||||||||||||||||||
| Man-years3, auxiliary nursing personnel | 6 629 | 5 536 | 5 216 | 5 061 | |||||||||||||||||||||||||||||||||||
| Man-years3, other occupational therapists | 689 | 516 | 772 | 903 | |||||||||||||||||||||||||||||||||||
| Man-years3, administration and service | 14 974 | 15 420 | 17 170 | 17 623 | |||||||||||||||||||||||||||||||||||
| 1 | Preliminary figures. |
| 2 | Data concerning out-patient consultations is not completed. |
| 3 |
Man-years is the number of full-time employees and part-time
employees (converted to full-time employees) at the end of the year. Overtime is not included. |
| 4 | Physiotherapists, medical laboratory technicians, radiographers and occupational therapsits. |
Tables:
- Table 1 Number of calculated man-years in general (somatic) institutions, by category of personnel. 1990-2001
- Table 2 Number of calculated man-years in general (somatic) hospitals, by category of personnel. 1980-2001
- Table 3 Number of calculated man-years in general hospitals, by category of personnel and county. 2001
- Table 4 Number of beds in general hospitals, by county. 1990-2001
- Table 5 Number of outpatient consultations in general hospitals, by county. 1990-2001
- Table 6 Discharges, by type of institution. 1990-2001
- Table 7 Number of bed-days, by type of institution. 1990-2001
The statistics is published with Specialist health service.
Contact
-
Statistics Norway's Information Centre
E-mail: informasjon@ssb.no
tel.: (+47) 21 09 46 42

