Content
Published:
This is an archived release.
Increase in outpatient treatments
From 1999 to 2000 the number of outpatient treatments in general hospitals increased by 5 per cent. During 2000 almost 3 600 000 patients were treated. Man-years in general hospitals increased by 1.5 per cent in 2000 compared with the previous year.
The main tendency in general hospitals goes towards shorter treatments. While the number of outpatient treatments increase, the number of inpatients does not increase to the same degree. The average length of stay is in addition getting shorter. Treatments that previously used to be an inpatient treatment are more often treated in polyclinics.
From 1999 to 2000 the number of inpatient stays showed a small decline of 0.8 per cent, while in the period from 1990 to 2000 the growth was12.9 per cent. In the same ten years period the number of outpatient treatments rose by 41 per cent, while there has been a growth from 1999 to 2000 of 5 per cent.
There were more than 166 000 outpatient day treatments in 2000. Day treatment mainly covers day surgery, rehabilitation, dialysis and cancer treatments. In addition such treatments also can cover patients admitted to hospital departments, and approximately 128 000 involved admitted day patients.
Increase in man-years and higher skills
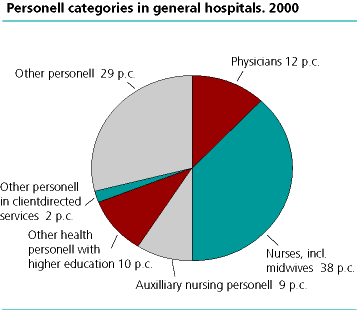
Approximately 58 500 man-years were attached to general hospitals by the end of year 2000. This is an increase of 1.5 per cent compared with the previous year, or a little more than 850 extra man-years. The increase is on the other hand the lowest since 1994. See the figure for the composition of personnel categories in the hospitals.
Man-years performed by physicians increased by 2.9 per cent, a little more than 200 man-years from 1999 to 2000. Nurses had a small decrease in man-years while auxiliary nurses had some decline.
If we look at the period from 1990 to 2000 there has been a solid growth of almost 26 per cent in man-years in general hospitals. The level of education rose due to new technology and a general increase in the need of higher skills at the hospitals, and it is university trained and other kinds of higher educated health personnel that have increased the most.
Man-years for medical doctors rose approximately 55 per cent, corresponding to 2 500 man-years. The number of nurses increased by 6700 or 43 per cent. Other higher educated personnel like bioengineers, physiotherapist, radiographs and occupational therapist also increased sharply during these period. Of these, bioengineers are now the biggest group with nearly 3100 man-years. Auxiliary nurses had a decline of 21 per cent in the numbers of man-years during the nineties. The numbers of man-years counted for auxiliary nurses were falling in the eighties too. Personnel working in administrative, technical and service functions constitute almost 17 200 man-years in 2000.
There have been some small changes due to revision compared to earlier publications for 1998 and 1999.
Tables:
- Table 1 Number of calculated man-years in general (somatic) institutions, by category of personnel. 1990-2000
- Table 2 Number of calculated man-years in general (somatic) hospitals, by category of personnel. 1980-2000
- Table 3 Number of calculated man-years in general hospitals, by category of personnel and county. 2000
- Table 4 Number of beds in general hospitals, by county. 1990-2000
- Table 5 Number of beds in general hospitals, by type of department. 1990-2000
- Table 6 Number of outpatient consultations in general hospitals, by county. 1990-2000 (Corrected 30 November 2001)
- Table 7 Discharges, by type of institution. 1990-2000
- Table 8 Number of bed-days, by type of institution. 1990-2000
- Table 9 Number of out-patient consultations, by type of hospital. 1990-2000
- Table 10 Number of discharges from general hospitals, by the hospital's county of administration. 1990-2000
- Table 11 Number of bed-days in general hospitals, by the hospital's county of administration. 1990-2000
- Table 12 Number of discharges from general hospitals, by the patients' county of residence. 1990-2000
- Table 13 Number of bed-days in general hospitals, by the patients' county of residence. 1990-2000
The statistics is published with Specialist health service.
Contact
-
Statistics Norway's Information Centre
E-mail: informasjon@ssb.no
tel.: (+47) 21 09 46 42