Content
Published:
This is an archived release.
More home nursing
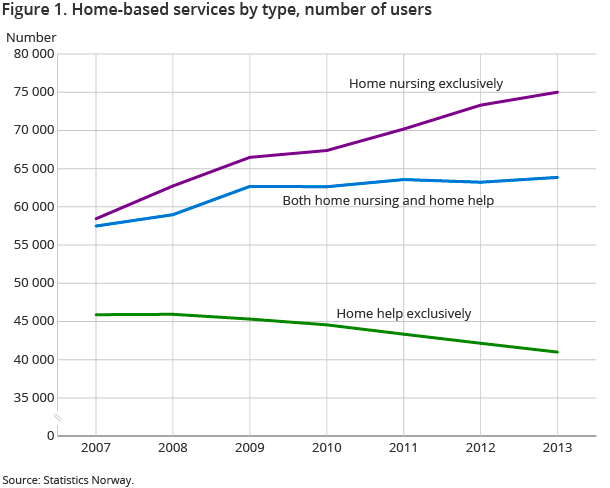
The number of users of both home help and nursing services shows a minor increase. However, the number that uses one of the services exclusively, shows a diverging trend. The number of users of home help services is decreasing, while the number of users of nursing services is increasing.
| 2013 | 2012 - 2013 | 2009 - 2013 | |
|---|---|---|---|
| Users of care services | Percentage change | ||
| Total | 271 406 | 0.0 | 1.9 |
| Users of home help only | 40 991 | -2.7 | -9.5 |
| Users of home nursing only | 75 011 | 2.3 | 12.8 |
| Users of both home help and home nursing | 63 856 | 1.0 | 1.9 |
| Residents in institutions, short term stay | 9 082 | -8.3 | -5.4 |
| Residents in institutions, long term stay | 33 968 | -0.1 | -2.4 |
| Other home-based services | 48 498 | -0.8 | 2.0 |
| Nursing and care institutions | |||
| Beds | 41 594 | -0.3 | |
| Percentage of private beds | 10.2 | 6.6 | |
| Percentage of user adapted single rooms including bathroom/WC in institutions | 79.9 | 3.1 | 32.7 |
| Weekly physician hours per resident in nursing homes | 0.46 | 7.0 | 35.3 |
| Care staff | |||
| Full-time equivalent | 132 694.22 | 1.2 | 7.5 |
| Percentage of man-years within user directed services with health/social educat | 74 | 0.0 | 2.8 |
| Andel legemeldt sykefravær av totalt antall kommunale årsverk i brukerrettet tj | 8.6 | -4.4 | -9.5 |
| Expenditure in municipal care services | |||
| Care services | 94 456 050 | 4.7 | 26 |
| Coordination Reform | 5 486 819 | 7 | . |


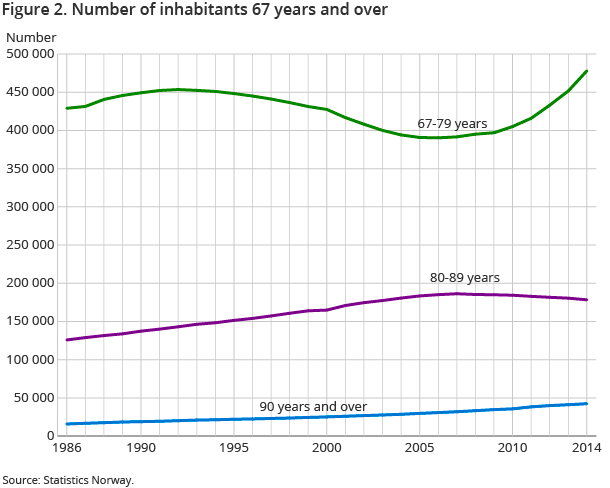
The KOSTRA figures show that the number of users of nursing and care services among elderly inhabitants is decreasing. The number of users (67 - 79 years) of home-based services has decreased to 71 per 1 000 inhabitant, a reduction of 3 per cent from 2012 and a reduction of 12 per cent since 2009. This is primarily due to demographic changes. The large post-war baby boom-generation has now reached the age of retirement, resulting in a group with less need for nursing and care services due to age.
Marginal changes in input and output indicators
There are only small changes from 2012 to 2013 when it comes to users of services and resources in nursing and care services, measured in for example beds and man-years. In 2013 there were 271 000 users of nursing and care services. There were 41 600 beds in institutions (mainly nursing homes). And for staff, there were 133 000 full-time equivalents working in the nursing and care services. The total expenditure for these services has increased by 4.7 per cent since 2012, and totalled NOK 94.5 billion in 2013.
Improved room quality
According to the authorities’ plans for the sector, there is a priority for nursing homes and home-based services compared to old people’s homes. Many beds in old people’s homes and nursing homes are upgraded with better standards, in example single rooms and private bathroom and WC. In 2013, 4 out of 5 beds in nursing homes were in such rooms.
The physician’s timeuse in nursing homes has increased by 7 per cent from 2012 to 2013, and by 35 per cent since 2009. In 2013, physicians provided services close to half an hour per resident per week. The physiotherapists’ time use in nursing homes has also increased since 2012, and amounts to 23 minutes per resident in 2013.
Almost unchanged staffing level
The action plan Qualification Boost 2015 is set to improve skills and increase recruitment to the sector. The figures show that 74 per cent out of 126 000 fulltime equivalents in user-directed services had health education. This is just a small increase from 72 per cent in 2009. Correspondingly, the indicator 'man-years per user' is close to half a full-time equivalent, a small increase from 2009.
More spending on home-based services than institutions
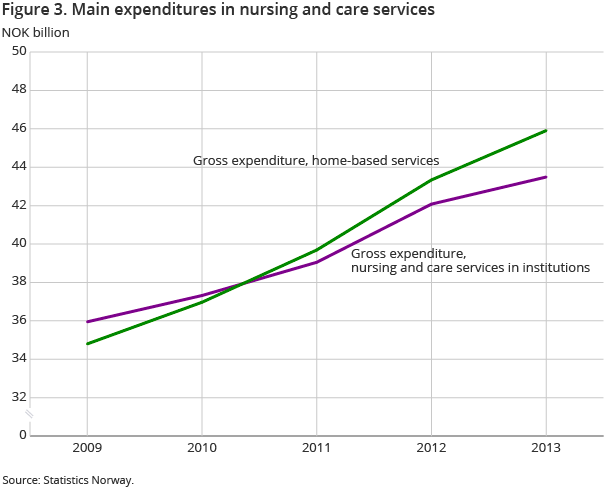
In 2009 48 per cent of total nursing and care expenses were used to finance institutional services, while 46.5 per cent of the expenses were used on home-based services. In 2013, the figures reversed in example a higher percentage of the expenses was used on home-based services (48.6 per cent) compared to institutional services (46 per cent).
This page has been discontinued, see Care services, Annually.
Contact
-
Dag Ragnvald Abrahamsen
E-mail: dag.ragnvald.abrahamsen@ssb.no
tel.: (+47) 40 90 25 46
-
Øyvind Isachsen Berntsen
E-mail: oyvind.berntsen@ssb.no
tel.: (+47) 40 90 23 28
-
Bjarne Tautra Hoen
E-mail: bjarne.hoen@ssb.no
tel.: (+47) 40 90 25 99
-
Linda M. Allertsen
E-mail: linda.allertsen@ssb.no
tel.: (+47) 97 09 97 51
