Content
Published:
This is an archived release.
Two thirds of population visited their GP
Almost everyone in Norway has a regular GP, and we visit our GP 2.5 times a year on average. Groups with a low level of education use GPs more often than others, while immigrants use them to a lesser extent than the population as a whole.
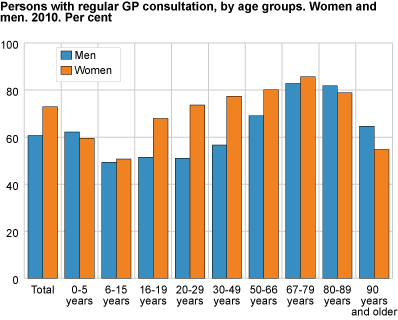
A patient’s first point of contact with the health service is normally through a general practitioner (GP). In 2010, 67 per cent of the population had a consultation with their regular GP, and the proportion was higher for women than men. Whether we visit our GP, and how often we visit him/her depends on various factors. These statistics show the contact with regular GPs broken down into a selection of sociodemographic variables.
New statisticsStatistics Norway publishes annual statistics on users of specialist health services ( Patient statistics ). Using register data means that key user groups of the GP service can now be tracked. These statistics show who uses and does not use a regular GP, as well as variations in the use of the service by variables such as gender, age, county of residence, level of education, immigrant category and country background. |
Visits to regular GPs increase up to age 80
The percentage of the population consulting their regular GP increases with age until the age of 80. In the age group 67-79, 84 per cent had a consultation with their regular GP in 2010, but the proportion is less for the over 80s. This is partly due to the fact that a certain percentage of the elderly die during the year of registration, but it may also be connected with the use of other health services. Elderly persons who are sick or dependent on help often receive health care at home or have access to a doctor and other health care professionals in nursing homes.
Patients with low level of education have most contact with regular GPs
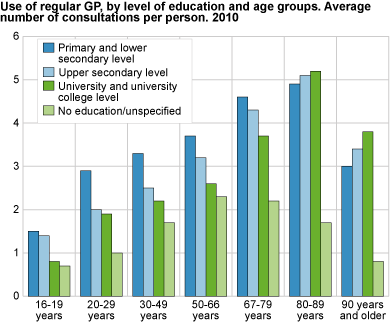
Studies in various subject areas have shown that those with a high level of education live longer and enjoy better health than groups with lower education. The highly educated also have less contact with their GP. Among the total population, 68 per cent of those with a high level of education visited their GP in 2010, compared to 73 per cent with a low level of education. The number of consultations per person was also higher for the latter of these two groups.
Among the elderly, however, the proportion that visited their GP is higher for persons with a higher level of education. This group had more consultations in 2010 than elderly persons with compulsory or upper secondary levels of education. Persons aged 80-89 with a high level of education visited their GP 5.2 times on average in 2010, compared with an average of 4.9 consultations by patients with compulsory schooling only. The disparities are even greater in the age group 90 years and older.
Immigrants use GP services less
Fewer immigrants use a regular GP than the rest of the population. However, the user pattern of Norwegian-born to immigrant parents is more similar to the pattern for the rest of the population. Two thirds of the population and slightly more than half of all immigrants visited their GP in 2010.
As a whole, the population of Norway visited their GP an average of 2.5 times in 2010, while immigrants had an average of 2.2 consultations. The different immigrant groups’ use of the GP service, however, varies according to country background.
Residents of Oslo visit their GP less often
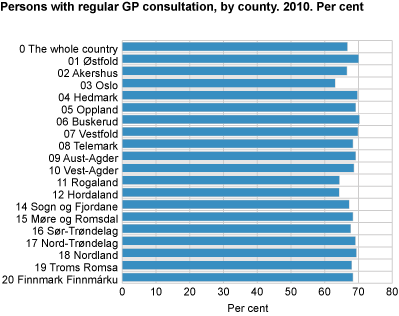
Approximately 63 per cent of Oslo residents visited their GP in 2010, while almost 70 per cent of the residents of the counties of Buskerud and Østfold had one or more consultations with their GP. This disparity may be related to the fact that Oslo has a relatively young population and a larger immigrant population, and that the level of education in Oslo is higher. The availability of private doctors and specialists in the capital is also better than in some of the counties. Residents of Oslo therefore have more choice in relation to paying for private medical care. The statistics are based on the patients’ home address, and are not corrected for persons who visit a doctor outside their county of residence.
General practitioner statistics, regular GPs - about the dataIn these statistics, data on the use of regular GP services is linked to information on the population’s education and country background. The data are based on reimbursement claims submitted by the regular GPs to the Norwegian Health Economics Administration (HELFO). The KUHR register (for the control and payment of reimbursements to health service providers) was established in 2004. The Norwegian Directorate of Health is responsible for the register, but it is administered by the Norwegian Labour and Welfare Service (NAV). Statistics Norway links the variables of patients initially from the National Education Database (NUDB) and statistical population registers. The statistics include everyone who is registered as resident in Norway in 2010. The statistics show consultations held with a regular GP, regardless of whether it was the patient’s own GP. Consultations include examinations and treatment at the GP’s medical practice, and are based on three main tariffs that entail a reimbursement for the regular GP. Consultation rates (from the Norwegian Medical Association’s normal tariff for private general practice 2010-2011) are as follows: 2ad + 2ak - Consultation with a GP, day rate + evening rate 2ed - Group treatment per patient for guidance etc. For further details of data sources, see About the statistics . |
Contact
-
Inger Texmon
E-mail: inger.texmon@ssb.no
tel.: (+47) 95 27 50 06
-
Arne Jensen
E-mail: arne.jensen@ssb.no
tel.: (+47) 99 71 22 45


