Content
Published:
This is an archived release.
Young females visited their GP twice as often as young males
On average, we consulted a GP 2.6 times in 2015. Women had more visits than men, particularly young adults in the ages between 16 and 49 years.
| 2015 | ||||
|---|---|---|---|---|
| General practitioner (GP) | Emergency primary health care | |||
| Share of persons | Consultations per person | Share of persons | Consultations per person | |
| All ages | 69 | 2.6 | 17 | 0.25 |
| 0-5 years | 64 | 1.7 | 30 | 0.47 |
| 6-15 years | 54 | 1.1 | 16 | 0.20 |
| 16-19 years | 64 | 1.7 | 20 | 0.29 |
| 20-29 years | 64 | 2.2 | 19 | 0.28 |
| 30-49 years | 68 | 2.6 | 15 | 0.21 |
| 50-66 years | 76 | 3.2 | 14 | 0.19 |
| 67-79 years | 85 | 4.1 | 16 | 0.23 |
| 80-89 years | 83 | 5.2 | 22 | 0.35 |
| 90 years or older | 61 | 3.4 | 22 | 0.34 |


A GP (general practitioner) is our first point of contact in the event of illness, injury or health problems. Emergency primary health care is used when our GP is not available and urgent medical care is needed. In 2015, seven out of ten people visited their doctor at least once, and nearly two out of ten visited an emergency care unit.
Young and middle-aged women visit their GP more than men
On average, women see their doctor more often than men do, with about three visits per year, which is almost one more visit than men. The disparity is greatest for the age groups 16 to 49, where women have almost twice as many GP visits as men. Much of this disparity can be explained by women’s increased GP visits due to prenatal care, contraception and follow-up of their reproductive health.
Perhaps not surprisingly, we see our GP more often when we grow older. The highest uptake of GP services is found in the age group 80-89 years, with more than 5 visits, versus one among children between 6 and 15 years. Those who are 90 years or more also have fewer visits. There may be several reasons for this. One may be that the healthiest among the 90 year-olds live in private households, and thus continue to use their GP, while the less healthy ones live in institutions, and receive health services there and have less need for GP consultations.
Increase over time in GP visits among the oldest
In general, the population’s use of GPs is fairly stable over time. However, there are some changes from year to year among the elderly. While the age group 67-79 years has seen a decrease, there has been an increase among the eldest. This particularly applies to men in the age group 90 years and over, where there has been an increase of 3 percentage points of "frequent users" (5 consultations or more) since 2010. The same trend is found among women, but with somewhat less of an impact (Figure 2).
The use of the GPs is probably influenced by the proportions of elderly living in private and institution households. The slow increase among the eldest during the last five years is thus most likely related to the increase in the proportion of people 90 years or over still living at home. The small decline in GP use among the elderly aged 67-79, however, can be related to an improvement of health in the age group over time. In particular, there has been a decrease in the use of GPs in relation to cardiovascular diseases and high blood pressure.
Many immigrants did not visit a GP
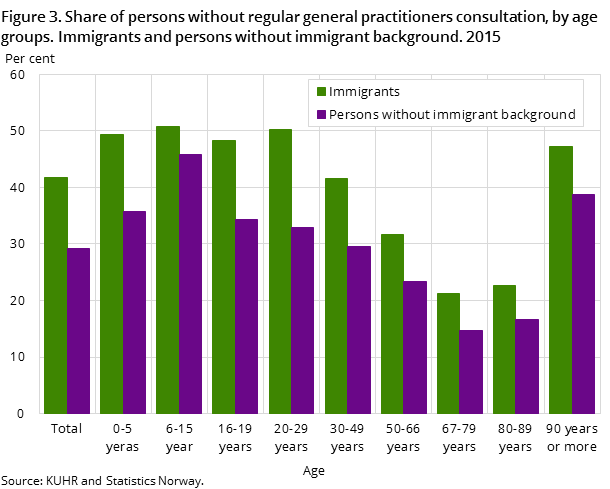
Only 58 percent of immigrants in Norway visited their GP in 2015. Sixty-five per cent of Norwegian-born children of immigrants had been there at least once, while the proportion in the rest of the population was 71 per cent. This means that three out of ten without an immigrant background did not go to the doctor in 2015 and more than four out of ten immigrants did not (Figure 3). When we look at the percentage that went to the doctor five or more times in 2015, the disparities were minor.
Also in the use of emergency care the immigrants follows a similar pattern; where 14 per cent of immigrants have been to an emergency care unit at least once, compared to 17 per cent of the general population. The largest user group of emergency care is Norwegian-born children of immigrants, with a usage share of 22 per cent.
Although immigrants as a group go less often to the GP and emergency care than the general population, there are rather large disparities between immigrants, by country background.
Emergency care visits down among children and adolescents
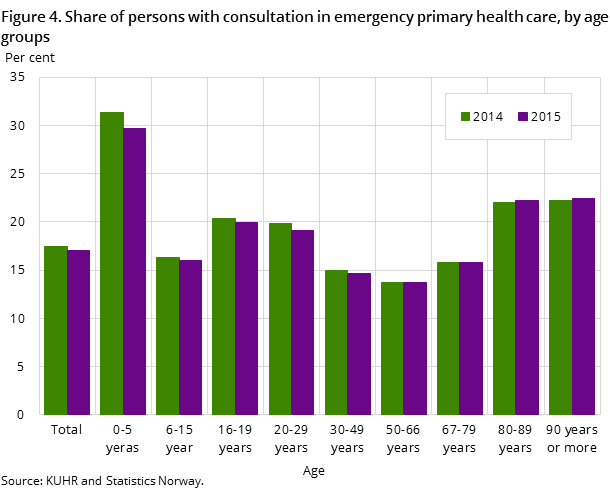
Altogether, the average number of consultations and the percentage who need emergency care declined somewhat over time, from 19 per cent who visited an emergency care unit in 2012, to 17 per cent in 2015. Also, the use of emergency care units shows a great variation with age, but here it is the younger children who use the services the most (see Figure 4). In this age group three out of ten had at least one emergency care consultation. The two oldest age groups (over 80 years) had the same level of use of emergency care, which was relatively high at about 22 per cent. The middle-aged were least likely to seek out an emergency care unit (only 13 per cent).
Diagnosis by ICPC-2 standardOpen and readClose
All diagnoses are coded according to the ICPC-2 standard. Statistics Norway publishes two different diagnosis tables in StatBank; one that has grouped together common diseases/ailments into 20 diagnostic groups and one that shows diagnoses in line with the chapters in the ICPC-2 standard. Both tables are based on the main diagnosis, i.e. what is considered the most important diagnosis/reason for a doctor visit. Secondary diagnosis is thus not included in the statistical basis.
Changes in emergency primary health care figuresOpen and readClose
The emergency care figures from 2012 are not fully comparable with later figures, as there were an unusually high number of patient consultations without a national identity in 2012. Some tables were therefore published with all consultations, while in the following years only the number of consultations that found a match in Statistics Norway’s registers was given. The number of consultations with no match is very low for GPs (below 1 per cent), and is better, but still somewhat high, for emergency care (roughly 3 per cent). Read more in About the statistics.
Contact
-
Inger Texmon
E-mail: inger.texmon@ssb.no
tel.: (+47) 95 27 50 06
-
Arne Jensen
E-mail: arne.jensen@ssb.no
tel.: (+47) 99 71 22 45
