Content
Published:
More coast guard reactions
Inspections by the coast guard are more likely to end in a reaction. In 2005, one in 13 inspections ended in a reaction and in 2013 this ratio was one in three.
| Value | Change in % last year | Change in % last 5 years | Year | |
|---|---|---|---|---|
| Input | ||||
| Own production (NOK billion) | 30.1 | 1.6 | 21.0 | 2013 |
| Own production (per NOK 100 of central government) | 10.66 | -4.2 | -7.2 | 2013 |
| Investments (NOK billion) | 8.2 | 11.1 | -2.6 | 2013 |
| Investments (per NOK 100 of central government) | 16.7 | -8.7 | -11.2 | 2013 |
| Contracted man-years adjusted for long-term leave, employees | 17 991 | 1.4 | 4.2 | 2013 |
| Contracted man-years adjusted for long-term leave, conscripts | 8 174 | -4.7 | -7.1 | 2013 |
| Contracted man-years adjusted for long term leaves (per 100 of central government) | 7.4 | -1.4 | -9.1 | 2013 |
| Activities and services | ||||
| Army: Excercise activity of officers (Number of 24 hours) | 15.2 | -13.1 | 33.3 | 2013 |
| Home guard: Active service (number of days) | 171 510 | 8.5 | -26.7 | 2013 |
| Home Guard: Number of tasks supporting civilian population and/or infrastructure | 7 | -12.5 | -72.0 | 2013 |
| Coast squadron: Sailing (hours) | 31 495 | 8.1 | 18.1 | 2013 |
| Coast guard: Sailing (days) | 3 817 | 5.9 | -8.8 | 2013 |
| Coast guard: Inspections | 1 671 | -2.3 | -5.9 | 2013 |
| Air Force: Flying (hours) | 21 265 | -10.0 | -1.8 | 2013 |
| Persons in operations abroad with duration of more than 30 days | 1 422 | -23.5 | -37.3 | 2013 |
| Outcomes | ||||
| Coast Guard: Number of reactions | 541 | 19.4 | 54.6 | 2013 |
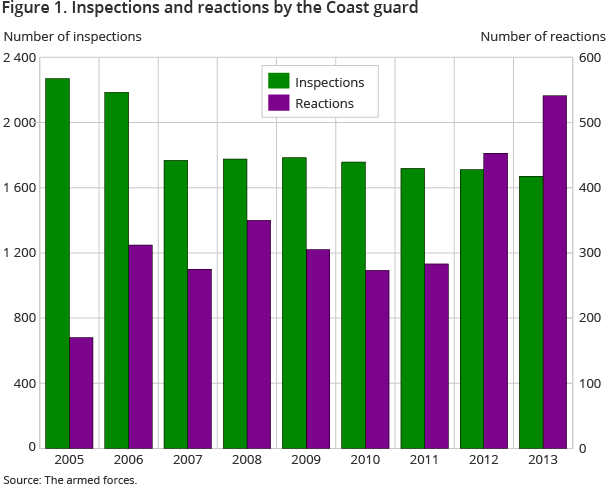
In 2013, the coast guard inspected 1 670 fishing vessels, resulting in 540 reactions. The number of inspections is the lowest registered between 2005 and 2013, while the number of reactions is the highest registered in the same period.
The total level of activity in the armed forces has been relatively stable from 2005 to 2013.
Figures for activity on land show that Army officers spent an average of 15 days on exercise in 2013. This is higher than the average number of exercise days for the whole period. Total service days in the Home Guard were 170 000, and this is the highest number since 2009, but less than half of the number of service days in 2006.
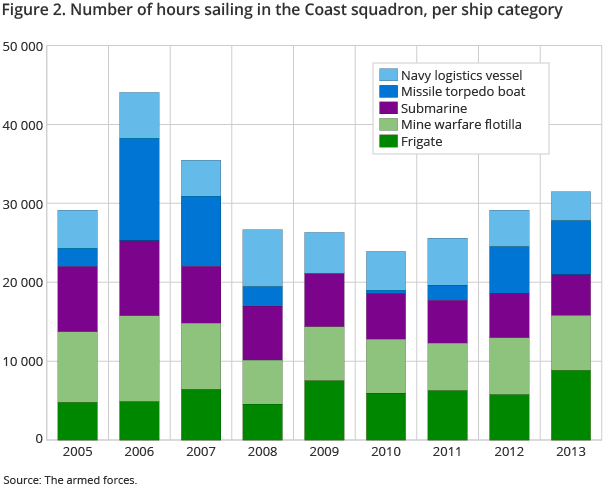
In 2013, naval vessels in the coast squadron had 31500 sailing hours and this is the highest level since 2007. Frigates account for the increase in sailing hours from 2012 to 2013. Coast Guard vessels had a total of 3 800 patrol days, which is the highest number in four years, but far less than in 2006 and 2007.
Total flying hours in the Air Force was about 22 000 in 2013, and this is less than in previous years. Flying hours for fighter aircraft is about 22 per cent lower than the average for the period 2005-2012.
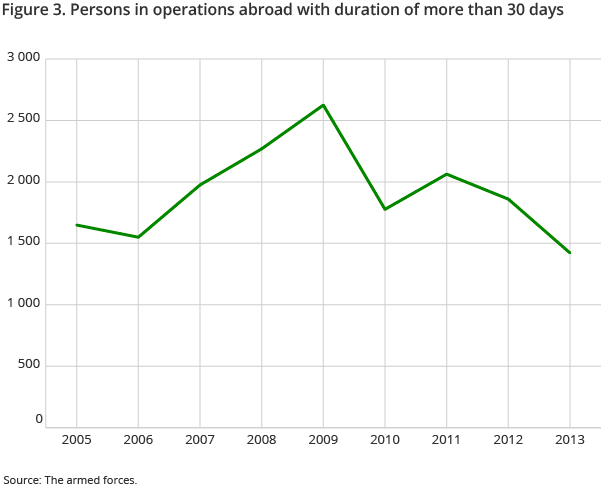
In 2013, more than 1 400 personnel participated in operations abroad with a duration of more than 30 days. This is the lowest number in the period 2005-2013 and the decrease is caused by the withdrawal of personnel from Afghanistan.
Low increase in expenditure compared to central government
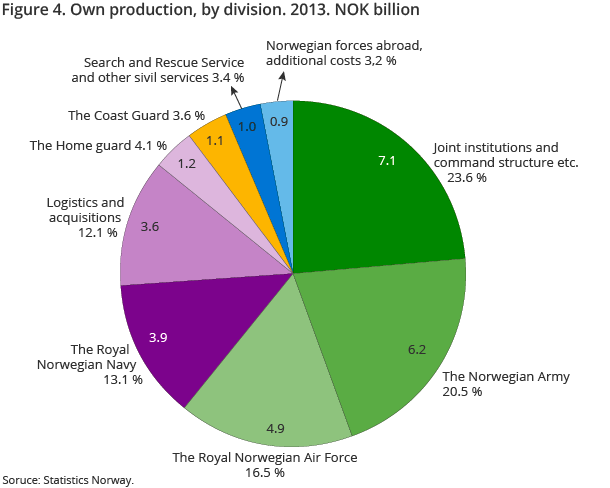
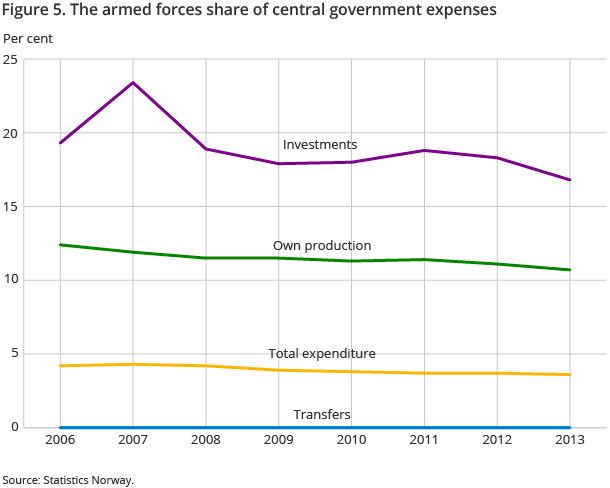
Total expenditure for the Norwegian Armed Forces was NOK 38.3 billion in 2013. This is about 30 per cent more than in 2006. The increase in central government expenditure in the same period was about 50 per cent. Expenditure for own production was about NOK 30 billion and accounts for 10.7 per cent of central government’s own production. In 2006, this share was 12.4 per cent and it has decreased for most years since then.
Investments in the Armed Forces have also increased less than total central government investments. In 2013, investments in the Armed Forces were NOK 8 billion; about NOK 2 billion more than in 2006. The Armed Forces’ share of total investments has decreased from 19.3 per cent to 16.8 per cent in the same period.
Contact
-
Statistics Norway's Information Centre
E-mail: informasjon@ssb.no
tel.: (+47) 21 09 46 42
