Content
Published:
This is an archived release.
Manufacturing down
The gross value of production for manufacturing went slightly down in 2003. Shipbuilding and production of fish and fish products experienced large decline, while oil refining and production of basic chemicals showed a solid growth. The employment in manufacturing is still decreasing and is the lowest since 1950.
Largest decrease in shipbuilding
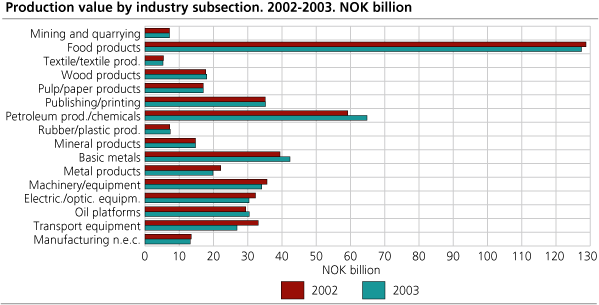
In 2003 the gross value of production in manufacturing and mining and quarrying totalled NOK 495 billion. This is a decrease of 0.8 per cent, or NOK 4 billion, measured in current prices.
The largest decrease is found in building and repairing of ships and boats, where the gross value of production went down by NOK 6 billion, or 26 per cent. The gross value of production in this industry reached its lowest level since 1996 at NOK 17 billion. Production of fish and fish products went down by 16 per cent, from NOK 25 billion in 2002 to NOK 21 billion in 2003. This is also the lowest level since 1996.
The biggest rise is found in oil refining and production of basic chemicals. The gross value of production went up by NOK 6 billion, or 9 per cent, after a drop by NOK 13 billion from 2000 to 2002.
Production of basic metals went up by 7 per cent, after a significant fall from 2000 to 2002.
Value added up
Value added measured in market prices in manufacturing increased by 3 per cent in 2003, in spite of the fall in production. The increase came especially in production of food, beverages and tobacco, oil refining and production of basic chemicals and production of basic metals. For oil refining and production of basic chemicals, the growth can be explained by a particularly low value added in 2002. Production of food, beverages and tobacco production of basic metals saw a fall in production costs, which gave these industries better results in 2003
In production of fish and fish products, some establishment with low value added shut down in 2003. This is why the production of fish and fish products went considerably down, while the value added was kept stable.
Investments down
Gross investment in manufacturing, mining and quarrying fell by 231 per cent in 2003.
Finishing of large building projects in the basic metals industry in 2002 pulls then investments down.
Other large industries, like production of food, beverages and tobacco, shipbuilding, paper industry, oil refining and production of basic chemicals, also experienced decreased investments.
Lowest level of employment since 1950
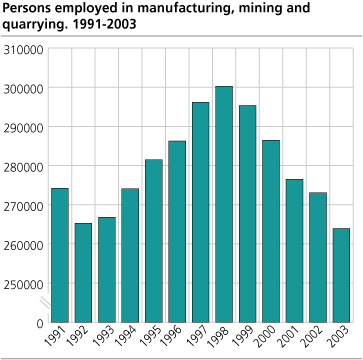
Manufacturing, mining and quarrying employed 264 thousand in 2003. This is the lowest employment since 1950. Compared with 1998, there are 36 thousand fewer persons employed. From 2002 employment went down by 9 thousand, or 3 per cent.
Most industries experienced reduced employment. There were two thousand fewer persons employed within building and repairing of ships and boats. This is a fall by 18 per cent. For building and repairing of oil-platforms and modules there were a reduction of more than one thousand persons employed. This is a fall by 7 per cent.
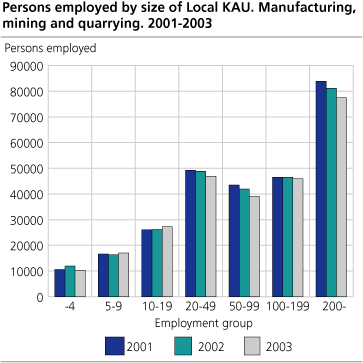
The drop in employment came particularly among the largest companies, and this was the case also in 2002.
| 1 | The figure was corrected 23.05.2005. |
Tables:
- Table 1 Mining, quarrying and manufacturing. Principal figures for local kind of activity units. 1972- 2003
- Table 2 Mining, quarrying and manufacturing. Principal figures for local kind of activity units, by industry division. 1999-2003
- Table 3 Mining, quarrying and manufacturing. Principal figures for local kind of activity units, by county. 2002-2003
The statistics is now published as Business statistics.
Contact
-
Statistics Norway's Information Centre
E-mail: informasjon@ssb.no
tel.: (+47) 21 09 46 42


