Content
Published:
This is an archived release.
Manufacturing growth in 2014
Value added in manufacturing and mining amounted to NOK 210.5 billion in 2014. Manufacturing and mining combined grew by 5.0 per cent from 2013 to 2014.
| 2014 | Change in per cent | ||
|---|---|---|---|
| 2013 - 2014 | 2007 - 2014 | ||
| 1At factor prices | |||
| Enterprises | |||
| Enterprises (number) | 17 701 | -1.4 | 3.0 |
| Persons employed | 242 266 | 0.8 | -4.9 |
| Turnover (NOK million) | 793 640 | 7.1 | 12.0 |
| Production value (NOK million) | 742 638 | 6.9 | 13.6 |
| Value added (NOK million)1 | 210 038 | 5.9 | 13.1 |
| Gross operating surplus (NOK million) | 63 986 | 10.6 | .. |
| Local kind of activity units | |||
| Local kind of activity units (number) | 19 454 | -0.9 | 3.1 |
| Persons employed | 240 603 | 0.6 | -5.3 |
| Compensation of employees (NOK million) | 145 574 | 3.8 | 18.8 |
| Production value (NOK million) | 832 339 | 4.5 | 10.9 |
| Value added (NOK million)1 | 210 534 | 5.0 | 10.7 |


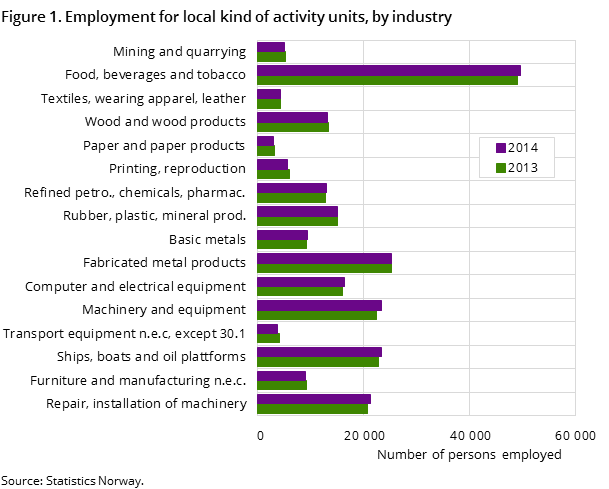
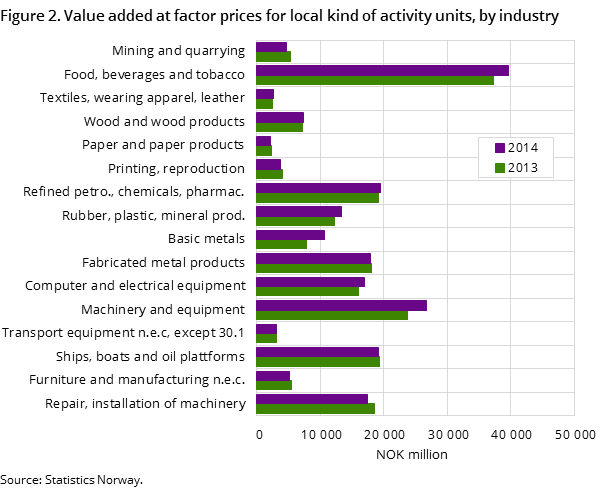
Manufacturing and mining employed about 240 000 people in 2014. This is about 1 300 more than in 2013. Value added in mining and quarrying decreased by 10.4 per cent. Within the manufacturing industry, value added grew by 5.4 per cent and the basic metals and machine industry made the largest contribution to economic growth.
Lower prices for coal and iron ore
Lower prices for coal and iron ore in 2014 contributed to the decline in the mining industry value added, measured in value added at factor prices. Lower coal prices limited coal production in Store Norske at Svalbard, while lower prices for iron ore led to poor results among businesses in the iron ore mining industry.
Strong rebound in basic metals
The basic metals industry rebounded sharply, growing 35.7 per cent year-on-year following a sharp decline of 16.1 per cent in 2013. Value added increased from NOK 7.9 billion to NOK 10.7 billion. In 2014, parts of the basic metals industry experienced a sharp rise in prices for aluminium, after these prices had fallen throughout 2013. The increase in aluminium prices in 2014 was boosted by the weaker NOK compared to the US dollar (USD).
High activity in parts of the machine industry
The machine industry rose by 12.2 per cent from NOK 23.8 billion to NOK 26.7 billion in 2014.
The increased value added in machine industry was mainly due to strong order books in parts of the industry, keeping activity high in 2014.
Value increase in food and beverage industry
The food and beverage industry had the highest value added in 2014 and grew by 6.0 per cent from NOK 37.4 billion to NOK 39.6 billion in 2014. The industry subgroup processing and preserving of fish experienced another strong year with a growth of 12.0 per cent. This happened after a growth of 30.0 per cent in 2013.
Rogaland still on top in 2014
Growth in some oil-related industries levelled off in 2014, but Rogaland still generated the highest value added, closely followed by Hordaland. The county with the lowest value added was Finnmark.
Slight decrease in the number of enterprises
Enterprise statistics show that there were around 17 700 enterprises in manufacturing and mining in 2014. This is a decrease of 1.4 per cent compared with the previous year. The enterprises, which can have establishments in other industries, had a turnover of NOK 794 billion at the end of the year; an increase of 7.1 per cent from the previous year.
Joint tables available in AprilOpen and readClose
Joint tables including all industry sections, divisions and groups will be available in Statbank at 10.00 am on Thursday, 28 April.
The statistics is now published as Business statistics.
Contact
-
Statistics Norway's Information Centre
E-mail: informasjon@ssb.no
tel.: (+47) 21 09 46 42
