Content
Published:
This is an archived release.
Large decline for manufacturing
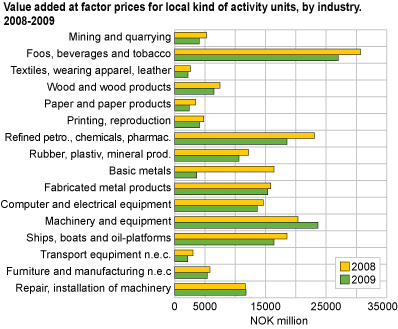
Value added for mining, quarrying and manufacturing fell by 14.4 per cent from 2008 to 2009. The largest decline was within basic metal production.
Value added, measured at factor cost, fell by NOK 28.3 billon from 2008 to 2009, and amounted to NOK 168 billion in 2009. Within production of basic metal the reduction in value added was NOK 12.7 billion, equal to a fall of 77.7 per cent. The industry experienced a decline in production value on the grounds of a marked drop in demand due to the financial crisis (see index of production and producer price index ). Production of basic metals went from being one of the largest manufacturing industries in 2008 to one of the smallest in 2009, measured by value added.
Growth for very few industries
Only two manufacturing industries grew in 2009. The greatest growth was that within machinery and equipment, where value added grew by NOK 3.3 billion, equal to 16.3 per cent.
Hordaland had the highest value added within mining, quarrying and manufacturing, with NOK 20.6 billion, and Rogaland and Møre og Romsdal had the second and third highest value added of close to NOK 17 billion respectively.
Fewer persons employed
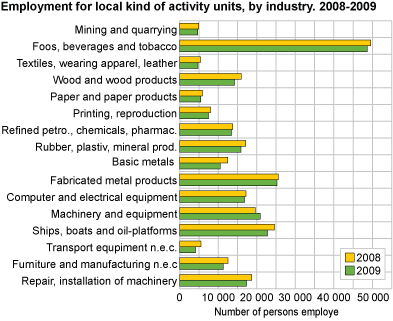
The number of persons employed within mining, quarrying and manufacturing was 243 600 in 2009; a reduction of 5.2 per cent. The only manufacturing industry with increased employment was machinery and equipment. There were approximately 13 000 fewer persons employed within mining, quarrying and manufacturing in 2009 than 2008. The biggest reduction was within basic metals, where the number of persons employed fell by almost 2 000.
Rogaland was the county that employed the most, with 26 838 persons employed within mining, quarrying and manufacturing. Hordaland follows closely behind with 26 746 persons employed.
Decline in gross investments
Gross investments fell by 27.6 per cent compared to 2008. In total, gross investments fell by NOK 9.1 billion and amounted to NOK 23.8 billion. Most industries experienced a reduction. Mining and quarrying was one of few industries with increased investments.
Enterprise figures for manufacturing, mining and quarrying
Enterprises within mining, quarrying and manufacturing employed 244 500 persons and had a production value of approximately NOK 615 billion. Value added was close to NOK 172 billion.
From industry to oil and gas extractionSeveral enterprises have been reclassified from manufacturing to service activities in the central register of establishments and enterprises. These enterprises are therefore no longer included in the statistics. To improve the comparison with previous periods, these enterprises have been removed from the population, and the figures have been recalculated for 2008. See about the statistics for more information . Statbank has been updated for 2008, and 2007 will be updated during this summer. |
Treatment of ancillary unitsWith regard to final figures for 2009, ancillary establishments and enterprises will be treated in the same way for all industries in the various structural business statistics releases. Ancillary enterprises are included in the characteristics “number of enterprises” and “number of persons employed”, whereas ancillary establishments are included in all characteristics. This is also the case for 2008 figures. |
Tables:
- Table 1 Mining, quarrying and manufacturing. Principal figures for local kind of activity units 1972 - 2009
- Table 2 Mining, quarrying and manufacturing. Principal figures for local kind of activity units, by industry division. 2008-2009
- Table 3 Mining, quarrying and manufacturing. Principal figures for enterprises, by industry division. 2008-2009
- Table 4 Mining, quarrying and manufacturing. Principal figures for local kind of activity units, by industry division and employment group. 2009
- Table 5 Mining, quarrying and manufacturing. Principal figures for enterprises, by industry division and employment group. 2009
- Table 6 Mining, quarrying and manufacturing. Persons employed and value added for local kind of activity units. County. 2008-2009
The statistics is now published as Business statistics.
Contact
-
Statistics Norway's Information Centre
E-mail: informasjon@ssb.no
tel.: (+47) 21 09 46 42


