Content
Published:
This is an archived release.
Growth in manufacturing in 2014
From 2013 to 2014, the production in manufacturing went up 3.3 per cent, according to working-day adjusted figures. Seasonally-adjusted figures show a 0.9 per cent growth in Norwegian manufacturing from the third to the fourth quarter of 2014, while there was an increase of 1.3 per cent from November to December.
| Seasonally adjusted | Calendar adjusted1 | Weights2 | ||
|---|---|---|---|---|
| Monthly change | Three-month change | Twelve-month change | ||
| December 2014 / November 2014 | October 2014 - December 2014 / July 2014 - September 2014 | December 2014 / December 2013 | ||
| 1Adjusted for working-days and for public holidays in Norway. | ||||
| 2The weights are updated annually, and are valid for the entire year. | ||||
| Extraction, mining, manufacturing and elec | 0.3 | 1.6 | 3.5 | 100.0 |
| Extraction and related services | 0.0 | 1.9 | 1.7 | 71.9 |
| Mining and quarrying | -0.6 | -2.4 | 13.1 | 0.6 |
| Manufacturing | 1.3 | 0.9 | 4.4 | 22.7 |
| Food, beverage and tobacco | 0.4 | -0.5 | 3.5 | 4.1 |
| Refined petro., chemicals, pharmac. | 0.7 | -3.7 | -2.2 | 2.0 |
| Basic metals | 1.8 | 1.3 | 3.9 | 1.1 |
| Machinery and equipment | 2.5 | 2.6 | 13.3 | 3.2 |
| Ships, boats and oil plattforms | -3.1 | -2.6 | 3.1 | 2.4 |
| Electricity, gas and steam | -0.7 | 3.8 | 9.8 | 4.8 |
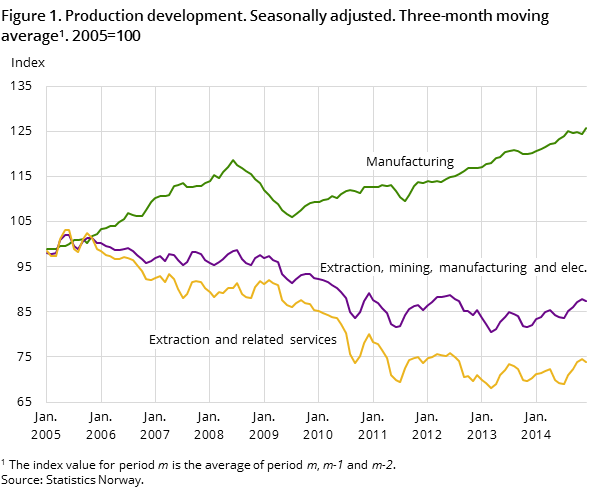
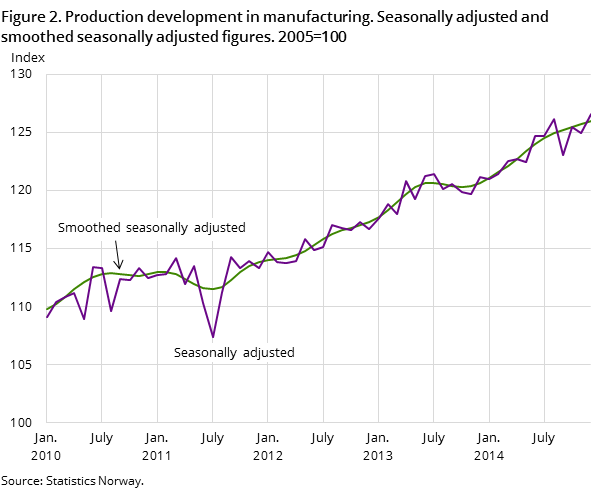
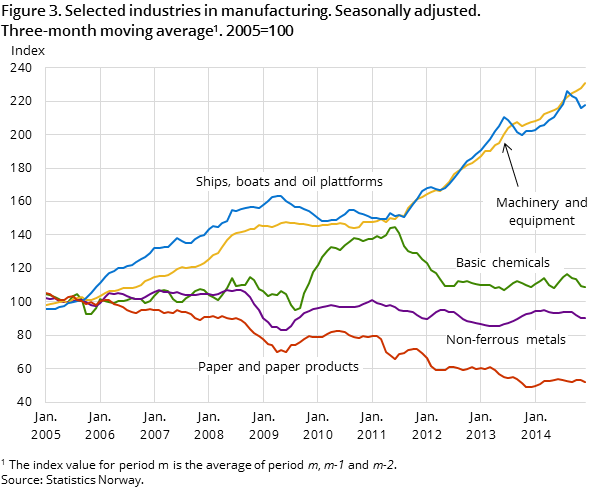
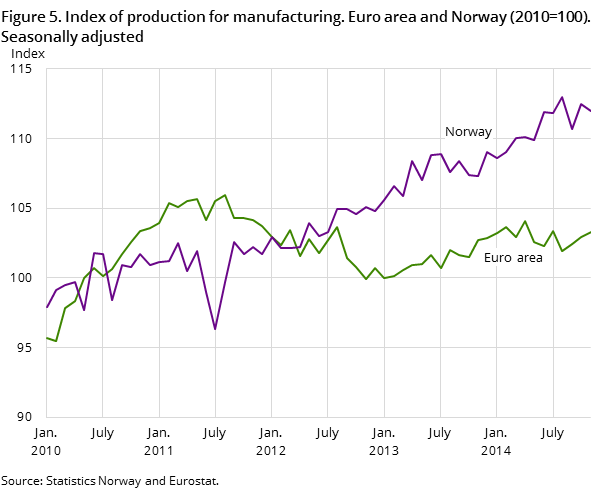
The annual growth of 3.3 per cent from 2013 to 2014 was partly related to the significant increase in production of ships, boats and oil platforms, and machinery and equipment. Within ships, boats and oil platforms, the growth was particularly high at the start of the third quarter. In addition, there was also an output increase within food and food products due to high production of fish and fish products, as well as feed and feed products. The production increase in fish and fish products was strongly related to high demand abroad for salmon. For more information about the annual growth, see table 7.
Three-month change: increase in manufacturing from the third to the fourth quarter of 2014
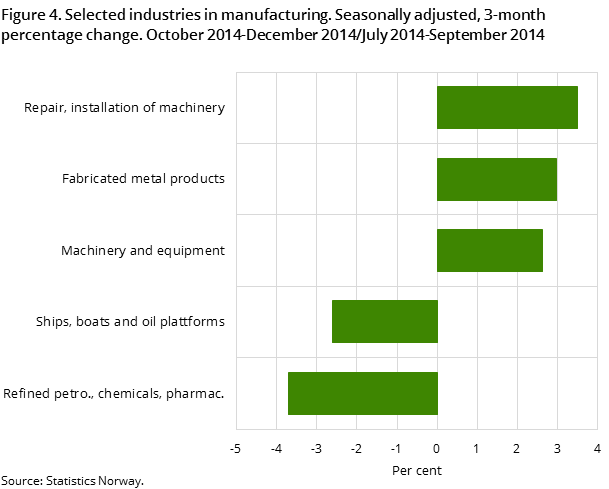
There was a 0.9 per cent increase in manufacturing from the third to the fourth quarter of 2014, according to seasonally-adjusted figures. Industries such as fabricated metal products, machinery and equipment, as well as repair and installation of machinery saw a production increase in this period. High activity among leading producers explains the growth within repair and installation of machinery in the fourth quarter. Machinery and equipment also maintained its high level of activity in the fourth quarter of 2014, and the industry has seen a production increase equivalent to 131 per cent since 2005.
On the other hand, the industry grouping refined petroleum, basic chemicals and the pharmaceutical industry had a production decline in this period. The downturn was partly due to shutdowns for planned maintenance work among main producers. In addition, ships, boats and oil platforms also saw an output decrease from the third to the fourth quarter of 2014. However, the production level in this industry still remains high and the decline must thus be seen in context with extraordinary activity in the previous quarter.
Monthly change: growth in machinery and equipment and basic chemicals from November to December
Basic chemicals, machinery and equipment, together with repair and installation of machinery had a production increase from November to December 2014, according to seasonally-adjusted figures. Within basic chemicals - a part of the industry grouping refined petroleum, basic chemicals and the pharmaceutical industry - the upturn must be seen in context with shutdowns for maintenance work among leading producers in the previous month. On the other hand, ships, boats and oil platforms had a decrease in production in the same period.
Twelve-month change: stronger growth in Norway than in the euro area in November 2014
Production in Norwegian manufacturing went up by 4.0 per cent from November 2013 to November 2014, according to calendar-adjusted figures. The growth can particularly be related to an output increase in industries such as machinery and equipment and ships, boats and oil platforms. Estimated figures from Eurostat, the EU`s statistical office, indicate that production in the manufacturing industries in the euro area increased by 0.3 per cent in the same period.
Three-month change: increase in total industrial production (PII)
The overall production index (PII) covering extraction, mining, manufacturing and electricity supply increased by 1.6 per cent from the third to the fourth quarter of 2014, according to seasonally-adjusted figures. In this period, extraction of crude petroleum declined by 4.2 per cent, while extraction of natural gas increased by 8.5 per cent. For more details about oil and gas extraction for December 2014, see the press release from The Norwegian Petroleum Directorate.
Production within Norwegian electricity supply increased 3.8 per cent from the third to the fourth quarter of 2014, according to seasonally-adjusted figures.
From 2013 to 2014: growth in total industrial production (PII) in 2014
The overall production index (PII) covering extraction, mining, manufacturing and electricity supply had an annual growth of 3.6 per cent from 2013 to 2014, according to calendar-adjusted figures. All the main sections saw an output increase from 2013 to 2014.
Contact
-
Production and turnover
E-mail: prodoms@ssb.no
