Content
Published:
This is an archived release.
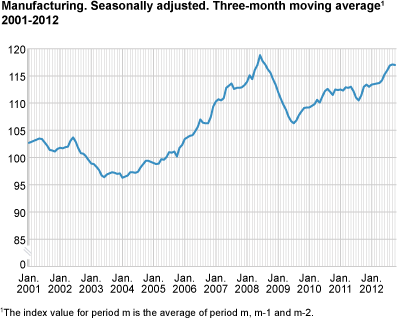
Growth in manufacturing
Production in manufacturing increased by 0.9 per cent from August to October 2012 compared with the previous three-month period, according to seasonally-adjusted figures.
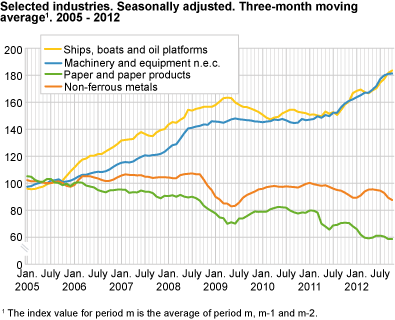
Industries such as machinery and equipment, repair, installation of machinery and ships, boats and oil platforms had a continued production growth in this period. This is in relation to a very high level of investments within the Norwegian petroleum sector (see investments in oil and gas activity and economic trends for Norway and abroad ). There was also a growth in computer and electrical equipment. In the same period there was a continued downturn in industries such as paper and paper products and non-ferrous metals. Paper and paper products have had a volume decline of more than 40 per cent since 2005. The corresponding growth for machinery and equipment, and ships, boats and oil platforms was more than 81 and 83 per cent respectively.
From October 2011 to October 2012
The output in manufacturing saw a growth of 2.7 per cent from October 2011 to October 2012, according to working-day adjusted figures. Industries like food products, machinery and equipment, together with ships, boats and oil platforms had a growth in production. On the other hand, paper and paper products, basic chemicals, basic metals and furniture and manufacturing had a drop in production in the same period.
From September to October 2012
The production in Norwegian manufacturing went down by 0.3 per cent from September to October 2012, according to seasonally-adjusted figures. Food products, paper and paper products and wood and wood products had a growth in production in this period. Industries such as rubber, plastic and mineral products, fabricated metal products and ships, boats and oil platforms had a downturn in production.
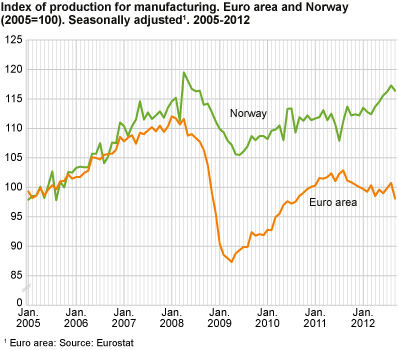
Norway and the Euro area
There was a 2.4 per cent increase in Norwegian manufacturing output from September 2011 to September 2012, according to working-day adjusted figures. Industrial production in the euro area decreased by 2.3 per cent in the same period, according to figures published by Eurostat .
| Adjusted for working-days 1 | Seasonally adjusted | ||||||||||||||||||||||||||||||||||||||||||||||||||||||||||||||||||||||||||||||
|---|---|---|---|---|---|---|---|---|---|---|---|---|---|---|---|---|---|---|---|---|---|---|---|---|---|---|---|---|---|---|---|---|---|---|---|---|---|---|---|---|---|---|---|---|---|---|---|---|---|---|---|---|---|---|---|---|---|---|---|---|---|---|---|---|---|---|---|---|---|---|---|---|---|---|---|---|---|---|---|
| October 2011- October 2012 | January 2011-October 2011- January 2012-October 2012 | September 2012- October 2012 | May 2012-July 2012- August 2012-October 2012 | ||||||||||||||||||||||||||||||||||||||||||||||||||||||||||||||||||||||||||||
| The overall index | 2.5 | 3.7 | 4.8 | -4.4 | |||||||||||||||||||||||||||||||||||||||||||||||||||||||||||||||||||||||||||
| Oil and Gas Extraction | 0.7 | 0.8 | 10.0 | -6.6 | |||||||||||||||||||||||||||||||||||||||||||||||||||||||||||||||||||||||||||
| Manufacturing | 2.7 | 2.7 | -0.3 | 0.9 | |||||||||||||||||||||||||||||||||||||||||||||||||||||||||||||||||||||||||||
| Electricity, Gas and Steam Supply | 1.2 | 18.8 | -7.2 | -9.0 | |||||||||||||||||||||||||||||||||||||||||||||||||||||||||||||||||||||||||||
| Main industrial groupings | |||||||||||||||||||||||||||||||||||||||||||||||||||||||||||||||||||||||||||||||
| Intermediate goods | 3.4 | 2.4 | 2.4 | 2.0 | |||||||||||||||||||||||||||||||||||||||||||||||||||||||||||||||||||||||||||
| Capital goods | 9.1 | 9.6 | 0.5 | 2.5 | |||||||||||||||||||||||||||||||||||||||||||||||||||||||||||||||||||||||||||
| Consumer goods | 3.8 | 1.3 | -0.6 | -0.8 | |||||||||||||||||||||||||||||||||||||||||||||||||||||||||||||||||||||||||||
| Energy goods | -1.7 | 1.8 | 9.4 | -6.9 | |||||||||||||||||||||||||||||||||||||||||||||||||||||||||||||||||||||||||||
| 1 | Adjusted for working-days and for public holidays in Norway. |
Interpretation of seasonally-adjusted figuresIn order to facilitate the interpretation of the short-term development, the index of production publishes three-month moving averages of the seasonally-adjusted figures. We normally compare the latest non-overlapping three-month periods, for instance August to October 2012 compared with May to July 2012. Seasonally-adjusted monthly changes must be interpreted with caution. |
Number of hours workedThe numbers of hours worked by contracted workers is included in the calculation of the Index of production for the first time from January 2012 onwards. These numbers are collected from January 2011. The inclusion of numbers of hours worked by contracted workers may lead to somewhat larger short-term fluctuations for some industries. At the same time, the development will be more accurately measured for industries where hours worked are used as an indicator. Industries like ships, boats and oil platforms and repair and installation of machinery typically use contracted workers in periods with high activity. |
New projectsNew projects in industries with hours worked as an indicator are intercepted at start-up, as long as the project is carried out by establishments covered by the sample. It is the total number of hours carried out in the survey period that is reported, regardless of which project the hours are spent on. |
Tables
Contact
-
Production and turnover
E-mail: prodoms@ssb.no