Content
Published:
This is an archived release.
Increase in production
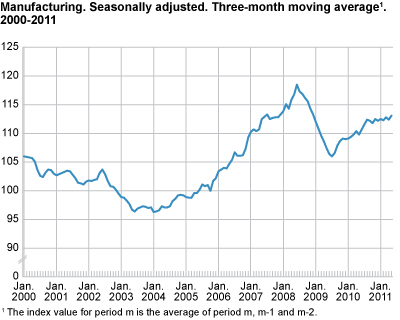
Production in manufacturing increased by 0.7 per cent from March to May 2011 compared with the previous three-month period, according to seasonally-adjusted figures.
The output in food, beverages and tobacco increased in the last period (see Business tendency survey ). Wood and wood products, refined petroleum, chemicals and pharmaceutical products and computer and electrical equipment also increased. On the other hand, the output in paper and paper products and in repair, installation of machinery decreased from March to May 2011 compared with the previous three-month period.
From May 2010 to May 2011
Production in manufacturing increased by 5.6 per cent from May 2010 to May 2011, according to working-day adjusted figures. Output in refined petroleum, chemicals and pharmaceutical products, machinery and equipment, and ships, boats and oil platforms went up. Paper and paper products had a drop in production.
From April to May 2011
The output in manufacturing went up 2.4 per cent from April to May 2011, according to seasonally-adjusted figures. Production increased in machinery and equipment, ships, boats and oil platforms,
and food, beverages and tobacco.
Norway and the euro area
There was a 0.7 per cent increase in Norwegian manufacturing output from April 2010 to April 2011, according to working-day adjusted figures. Industrial production in the euro area increased by 6.5 per cent in the same period, according to figures published by Eurostat .
| Adjusted for working-days1 | Seasonally adjusted | ||||||||||||||||||||||||||||||||||||||||||||||||||||||||||||||||||||||||||||||
|---|---|---|---|---|---|---|---|---|---|---|---|---|---|---|---|---|---|---|---|---|---|---|---|---|---|---|---|---|---|---|---|---|---|---|---|---|---|---|---|---|---|---|---|---|---|---|---|---|---|---|---|---|---|---|---|---|---|---|---|---|---|---|---|---|---|---|---|---|---|---|---|---|---|---|---|---|---|---|---|
| May 2010- May 2011 |
January 2010- May 2010- January 2011- May 2011 |
April 2011- May 2011 |
December 2010- February 2011- March 2011- May 2011 |
||||||||||||||||||||||||||||||||||||||||||||||||||||||||||||||||||||||||||||
| The overall index | -12.4 | -8.0 | -2.7 | -5.0 | |||||||||||||||||||||||||||||||||||||||||||||||||||||||||||||||||||||||||||
| Oil and Gas Extraction | -22.2 | -12.4 | -6.9 | -8.1 | |||||||||||||||||||||||||||||||||||||||||||||||||||||||||||||||||||||||||||
| Manufacturing | 5.6 | 2.9 | 2.4 | 0.7 | |||||||||||||||||||||||||||||||||||||||||||||||||||||||||||||||||||||||||||
| Electricity, Gas and Steam Supply | 15.0 | -10.1 | 7.5 | -2.7 | |||||||||||||||||||||||||||||||||||||||||||||||||||||||||||||||||||||||||||
| Main industrial groupings | |||||||||||||||||||||||||||||||||||||||||||||||||||||||||||||||||||||||||||||||
| Intermediate goods | 3.9 | 4.9 | -1.7 | -0.5 | |||||||||||||||||||||||||||||||||||||||||||||||||||||||||||||||||||||||||||
| Capital goods | 5.2 | 1.6 | 4.5 | -0.8 | |||||||||||||||||||||||||||||||||||||||||||||||||||||||||||||||||||||||||||
| Consumer goods | 8.9 | 2.1 | 1.4 | 2.4 | |||||||||||||||||||||||||||||||||||||||||||||||||||||||||||||||||||||||||||
| Energy goods | -19.6 | -12.9 | -7.3 | -8.1 | |||||||||||||||||||||||||||||||||||||||||||||||||||||||||||||||||||||||||||
| 1 | Adjusted for working-days and for public holidays in Norway. |
Interpretation of seasonally-adjusted figuresIn order to facilitate the interpretation of the short-term development, the index of production publishes three-month moving averages of the seasonally-adjusted figures. We normally compare the latest non-overlapping three-month periods, for instance March to May 2011 compared with December 2010 to February 2011. Seasonally-adjusted monthly changes must be interpreted with caution. |
Tables
Contact
-
Production and turnover
E-mail: prodoms@ssb.no

