Content
Published:
This is an archived release.
Minor changes in manufacturing
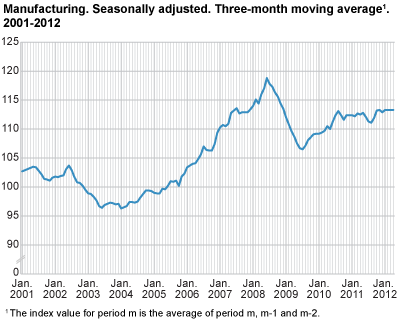
The production in manufacturing was unchanged from February to April 2012 compared with the previous three-month period, according to seasonally-adjusted figures.
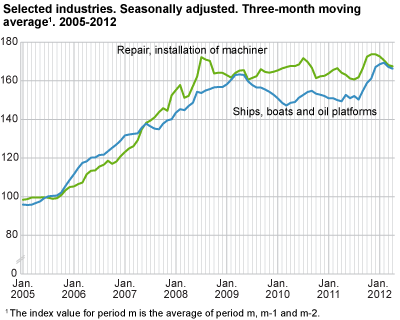
Food products, basic metals and machinery and equipment had a growth in production in this period whereas there was a slight drop in production for ships, boats and oil platforms and repair and installation of machinery. These oil and gas-related industries have seen substantial growth in 2011 and since 2005. Due to a further decline in the Norwegian solar cell industry, the production in basic chemicals dropped from February to April 2012 compared with the previous months.
From April 2011 to April 2012
There was a 1.9 per cent growth in manufacturing from April 2011 to April 2012, according to working-day adjusted figures. Industries like machinery and equipment and ships, boats and oil platforms have had a significant growth. Food products have also seen a 3.8 per cent growth in production. Industries like basic chemicals and basic metals, however, have seen a drop in the production from April 2011 to April 2012.
From March to April 2012
The production in manufacturing went up by 1.1 per cent from March to April 2012, according to seasonally-adjusted figures. Repair and installation of machinery had a growth in production, while industries like food products and basic chemicals showed a decrease.
Norway and the euro area
There was a 0.7 per cent decrease in Norwegian manufacturing output from March 2011 to March 2012, according to working-day adjusted figures. Industrial production in the euro area decreased by 1.5 per cent in the same period, according to figures published by Eurostat .
| Adjusted for working-days 1 | Seasonally adjusted | ||||||||||||||||||||||||||||||||||||||||||||||||||||||||||||||||||||||||||||||
|---|---|---|---|---|---|---|---|---|---|---|---|---|---|---|---|---|---|---|---|---|---|---|---|---|---|---|---|---|---|---|---|---|---|---|---|---|---|---|---|---|---|---|---|---|---|---|---|---|---|---|---|---|---|---|---|---|---|---|---|---|---|---|---|---|---|---|---|---|---|---|---|---|---|---|---|---|---|---|---|
| April 2011- April 2012 | January 2011-April 2011- January 2012-April 2012 | March 2012- April 2012 | November 2011-January 2012- February 2012-April 2012 | ||||||||||||||||||||||||||||||||||||||||||||||||||||||||||||||||||||||||||||
| The overall index | 7.5 | 3.9 | 2.4 | 2.4 | |||||||||||||||||||||||||||||||||||||||||||||||||||||||||||||||||||||||||||
| Oil and Gas Extraction | 4.2 | - | 1.7 | 0.9 | |||||||||||||||||||||||||||||||||||||||||||||||||||||||||||||||||||||||||||
| Manufacturing | 1.9 | 0.9 | 1.1 | - | |||||||||||||||||||||||||||||||||||||||||||||||||||||||||||||||||||||||||||
| Electricity, Gas and Steam Supply | 44.5 | 34.7 | 10.6 | 14.6 | |||||||||||||||||||||||||||||||||||||||||||||||||||||||||||||||||||||||||||
| Main industrial groupings | |||||||||||||||||||||||||||||||||||||||||||||||||||||||||||||||||||||||||||||||
| Intermediate goods | -0.9 | 3.4 | -0.2 | -1.6 | |||||||||||||||||||||||||||||||||||||||||||||||||||||||||||||||||||||||||||
| Capital goods | 9.2 | 8.5 | -1.1 | -0.1 | |||||||||||||||||||||||||||||||||||||||||||||||||||||||||||||||||||||||||||
| Consumer goods | -1.2 | -2.9 | 1.0 | 1.2 | |||||||||||||||||||||||||||||||||||||||||||||||||||||||||||||||||||||||||||
| Energy goods | 9.3 | 2.8 | 3.3 | 2.2 | |||||||||||||||||||||||||||||||||||||||||||||||||||||||||||||||||||||||||||
| 1 | Adjusted for working-days and for public holidays in Norway. |
Interpretation of seasonally-adjusted figuresIn order to facilitate the interpretation of the short-term development, the index of production publishes three-month moving averages of the seasonally-adjusted figures. We normally compare the latest non-overlapping three-month periods, for instance February to April 2012 compared with November 2011 to January 2012. Seasonally-adjusted monthly changes must be interpreted with caution. |
Number of hours workedThe numbers of hours worked by contracted workers is included in the calculation of the Index of production for the first time from January 2012 onwards. These numbers are collected from January 2011. The inclusion of numbers of hours worked by contracted workers may lead to somewhat larger short-term fluctuations for some industries. At the same time, the development will be more accurately measured for industries where hours worked is used as an indicator. Industries like ships, boats and oil platforms and repair and installation of machinery typically use contracted workers in periods with high activity. |
New projectsNew projects in industries with hours worked as an indicator are intercepted as they start up, as long as the project is carried out by establishments covered by the sample. It is the total number of hours carried out in the survey period that is reported, regardless of which project the hours are used on. |
Tables
Contact
-
Production and turnover
E-mail: prodoms@ssb.no