Content
Published:
This is an archived release.
Improvements in production
Production in Norwegian manufacturing increased by 1.2 per cent in the third quarter compared with the second quarter of 2010, according to seasonally-adjusted figures. The main contributors to this development were basic chemicals as well as ship and oil platforms.
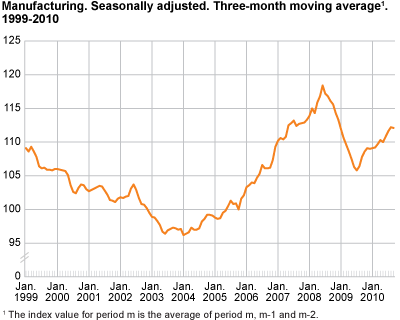
Production in basic chemicals increased by 9.3 per cent. The positive development in wood and wood products has continued, and output in this industry increased by 6.3 per cent in the third quarter of 2010. Production in manufacturing has gradually improved since the downturn caused by the financial crisis. The third quarter of 2010 is the fifth subsequent quarter with growth in output. Production is now 7 per cent higher than in June 2009
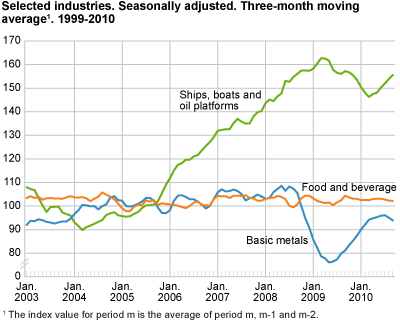
Increasing output in ships and oil platforms
Output in building of ships and oil platforms went up 3.6 per cent in the third quarter compared with the second quarter. Production in this industry went down by 12 per cent from March 2009 to March 2010, according to seasonally-adjusted figures. However, from March to September 2010 production has increased and is now up 8 per cent. Stock of new order in this industry is also increasing (see statistics on new orders ).
Decreasing output in basic metals and fabricated metal products
In spite of increasing production in manufacturing in general, several industries saw a decline in production. Production in basic metals went down by 2.1 per cent, while output in fabricated metal products decreased by 2.3 per cent. Food products went down by 1.5 per cent in the third quarter.
From September 2009 to September 2010
Output in manufacturing went up by 3.3 per cent from September 2009 to September 2010, according to working-day adjusted figures. Output in wood and wood products and basic metals increased by 15.7 and 13.8 per cent respectively, while repair and installation of machinery went down by 1.6 per cent.
From August to September 2010
Output in Norwegian manufacturing increased by 1.6 per cent from August to September 2010, according to seasonally-adjusted figures. Production in food products went up by 1.5 per cent. This development is partly due to an increase in the export of fish and fish products in September, see statistics on external merchandise trade . There was also an increase in output in fabricated metal products, computer and electrical equipment and transport equipment.
Norway and the euro area
There was a 2.6 per cent increase in Norwegian manufacturing output from August 2009 to August 2010, according to working-day adjusted figures. Industrial production in the euro area increased by 9.1 per cent in the same period, according to figures published by Eurostat .
| Adjusted for working-days1 | Seasonally adjusted | ||||||||||||||||||||||||||||||||||||||||||||||||||||||||||||||||||||||||||||||
|---|---|---|---|---|---|---|---|---|---|---|---|---|---|---|---|---|---|---|---|---|---|---|---|---|---|---|---|---|---|---|---|---|---|---|---|---|---|---|---|---|---|---|---|---|---|---|---|---|---|---|---|---|---|---|---|---|---|---|---|---|---|---|---|---|---|---|---|---|---|---|---|---|---|---|---|---|---|---|---|
| September 2009- September 2010 |
January 2009-September 2009- January 2010-September 2010 |
August 2010- September 2010 |
April 2010-June 2010- July 2010-September 2010 |
||||||||||||||||||||||||||||||||||||||||||||||||||||||||||||||||||||||||||||
| The overall index | -10.9 | -6.1 | 1.8 | -6.7 | |||||||||||||||||||||||||||||||||||||||||||||||||||||||||||||||||||||||||||
| Oil and Gas Extraction | -17.2 | -9.3 | 1.6 | -11.2 | |||||||||||||||||||||||||||||||||||||||||||||||||||||||||||||||||||||||||||
| Manufacturing | 3.3 | 2.6 | 1.6 | 1.2 | |||||||||||||||||||||||||||||||||||||||||||||||||||||||||||||||||||||||||||
| Electricity, Gas and Steam Supply | -13.5 | -5.9 | 5.3 | 4.1 | |||||||||||||||||||||||||||||||||||||||||||||||||||||||||||||||||||||||||||
| Main industrial groupings | |||||||||||||||||||||||||||||||||||||||||||||||||||||||||||||||||||||||||||||||
| Intermediate goods | 6.1 | 5.0 | 3.4 | -1.5 | |||||||||||||||||||||||||||||||||||||||||||||||||||||||||||||||||||||||||||
| Capital goods | - | -1.1 | 1.2 | 0.1 | |||||||||||||||||||||||||||||||||||||||||||||||||||||||||||||||||||||||||||
| Consumer goods | 6.1 | 1.4 | 2.9 | 4.3 | |||||||||||||||||||||||||||||||||||||||||||||||||||||||||||||||||||||||||||
| Energy goods | -19.3 | -10.5 | 1.0 | -9.6 | |||||||||||||||||||||||||||||||||||||||||||||||||||||||||||||||||||||||||||
| 1 | Adjusted for working-days and for public holidays in Norway. |
New table in StatBankFrom September 2010, series on annual figures are published in the StatBank (table 08297). Annual figures are calculated as the arithmetic mean of the working-day adjusted monthly figures. |
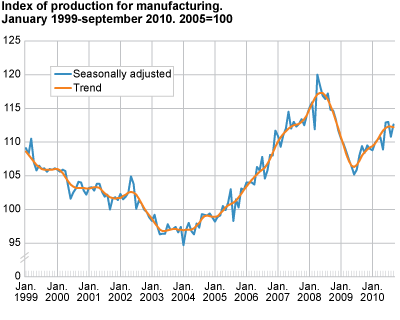
Interpretation of seasonally adjusted figuresIn order to facilitate the interpretation of the short-term development, the index of production publishes three-month moving averages of the seasonally adjusted figures. We normally compare the latest non-overlapping three-month periods, for instance July to September compared with April to June. Seasonally-adjusted monthly changes must be interpreted with caution. |
Tables
Contact
-
Production and turnover
E-mail: prodoms@ssb.no