Content
Published:
This is an archived release.
Improvements for manufacturing
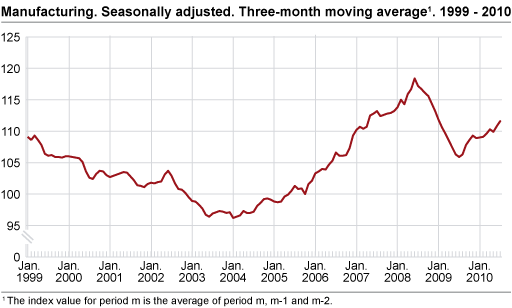
According to seasonally-adjusted figures, production in manufacturing increased by 1.2 per cent from May to July 2010 compared with the previous three-month period.
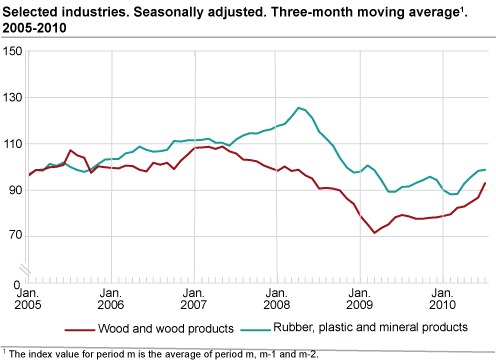
Output in wood and wood products went up by 12.0 per cent, while rubber, plastic and mineral products increased by 6.4 per cent. This development is due to increased building activity in Norway (see statistics on construction, new orders ). Output in ships and oil platforms went up by 3.3 per cent.
Basic chemicals went up by 3.2 per cent from May to July 2010 compared with the pervious three-month period. Production in basic chemicals is now higher than before the financial crisis. The main contributor to this upturn is the increased activity in Norwegian solar industry. Production in food products was unchanged, while fabricated metal products went down by 1.4 per cent.
From July 2009 to July 2010
Output in manufacturing went up by 6.6 per cent from July 2009 to July 2010, according to working-day adjusted figures. Wood and wood products increased by 29.1 per cent, while basic metals had a 21.9 per cent growth.
Output in food products as well as printing and reproduction went down. Basic chemicals went up by 68.5 per cent from July 2009 to July 2010. This upturn is due to high production in July 2010 compared to July 2009, when many production units were closed down due to low demand.
From June to July 2010
Output in Norwegian manufacturing increased by 0.1 per cent from June to July 2010, according to seasonally-adjusted figures. Output in wood and wood products increased by 10.0 per cent, while output in ships and oil platforms went up by 3.9 per cent. Output in food products as well as fabricated metal products went down. Seasonally-adjusted figures show a 16.6 per cent growth in basic chemicals from June to July 2010. Monthly changes must be interpreted with caution. This is particularly important for basic chemicals due to the lack of a consistent seasonal pattern in this industry.
Norway and the euro area
There was a 7.3 per cent increase in Norwegian manufacturing output from June 2009 to June 2010, according to working-day adjusted figures. Industrial production in the euro area increased by 8.1 per cent in the same period, according to figures published by Eurostat .
| Adjusted for working-days1 | Seasonally adjusted | ||||||||||||||||||||||||||||||||||||||||||||||||||||||||||||||||||||||||||||||
|---|---|---|---|---|---|---|---|---|---|---|---|---|---|---|---|---|---|---|---|---|---|---|---|---|---|---|---|---|---|---|---|---|---|---|---|---|---|---|---|---|---|---|---|---|---|---|---|---|---|---|---|---|---|---|---|---|---|---|---|---|---|---|---|---|---|---|---|---|---|---|---|---|---|---|---|---|---|---|---|
| July 2009-July 2010 | January 2009-July 2009-January 2010-July 2010 | June 2010-July 2010 | February 2010-April 2010-May 2010-July 2010 | ||||||||||||||||||||||||||||||||||||||||||||||||||||||||||||||||||||||||||||
| The overall index | -7.8 | -4.5 | -2.9 | -3.2 | |||||||||||||||||||||||||||||||||||||||||||||||||||||||||||||||||||||||||||
| Oil and Gas Extraction | -12.4 | -7.0 | -5.7 | -4.5 | |||||||||||||||||||||||||||||||||||||||||||||||||||||||||||||||||||||||||||
| Manufacturing | 6.6 | 2.5 | 0.1 | 1.2 | |||||||||||||||||||||||||||||||||||||||||||||||||||||||||||||||||||||||||||
| Electricity, Gas and Steam Supply | 0.4 | -3.6 | 12.8 | -9.5 | |||||||||||||||||||||||||||||||||||||||||||||||||||||||||||||||||||||||||||
| Main industrial groupings | |||||||||||||||||||||||||||||||||||||||||||||||||||||||||||||||||||||||||||||||
| Intermediate goods | 30.5 | 5.5 | -0.6 | -1.9 | |||||||||||||||||||||||||||||||||||||||||||||||||||||||||||||||||||||||||||
| Capital goods | 0.1 | -1.1 | -0.7 | 0.8 | |||||||||||||||||||||||||||||||||||||||||||||||||||||||||||||||||||||||||||
| Consumer goods | 6.1 | 0.4 | 3.5 | 1.2 | |||||||||||||||||||||||||||||||||||||||||||||||||||||||||||||||||||||||||||
| Energy goods | -14.6 | -8.0 | -5.7 | -4.9 | |||||||||||||||||||||||||||||||||||||||||||||||||||||||||||||||||||||||||||
| 1 | Adjusted for working-days and for public holidays in Norway. |
Recalculated figures for the second quarter of 2010Due to problems associated with the valuation of certain products within wood and wood products, Statistics Norway has recalculated the second quarter of 2010. Information received since the previous dissemination of the index has also been incorporated in the new numbers. The most significant change is in wood and wood products. After the recalculation wood and wood products had a 5.3 per cent growth from the first to the second quarter in 2010, while previous calculation showed a 9.1 per cent increase. The development in computer and electrical equipment is also changed. The previous calculation indicated a 0.2 per cent increase, while the new calculation shows a 2.3 per cent growth in the same period. There are only minor changes in other industries and the over-all development in manufacturing has not changed. |
Tables
Contact
-
Production and turnover
E-mail: prodoms@ssb.no


