Content
Published:
This is an archived release.
Growth in manufacturing
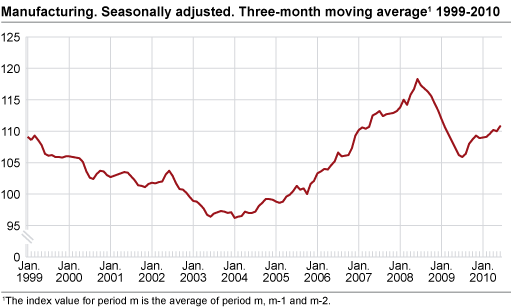
Production in Norwegian manufacturing increased by 1.1 per cent in the second quarter compared with the first quarter in 2010, according to seasonally-adjusted figures.
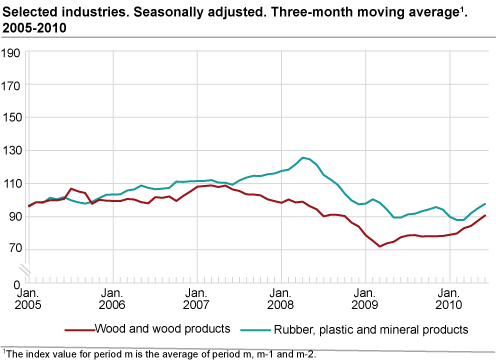
Wood and wood products and rubber, plastic and mineral products were the main contributors to this upturn. These industries went up by 9.1 and 10.9 per cent respectively. This is partly due to an upturn in building activities in Norway (see Building Statistics ). Paper and paper products and basic metals also saw an increase in output in the second quarter. This is consistent with the reported expectation of increased production of intermediate goods (see Business Tendency Survey ).
Positive results for ships, boats and oil platforms
Output in ships, boats and oil platforms increased by 2.4 per cent in the second quarter compared with the first quarter in 2010. This upturn follows several quarters with declining output due to lower demand both home and abroad. Production in ships, boats and oil platforms is now 8 per cent lower than the record-high figures in the first quarter of 2009.
From June 2009 to June 2010
In the aftermath of the financial crisis, production in Norwegian manufacturing dropped to its lowest level in June 2009. Working-day adjusted figures show that production has increased by 7.2 per cent since then. Wood and wood products, as well as basic metals have seen a significant increase since June 2009. Output in food products went up by 6.4 per cent.
From May to June 2010
Following relatively weak figures the previous month, production in manufacturing saw a 3.3 per cent increase from May to June 2010, according to seasonally-adjusted figures. The main contributors to this development were wood and wood products and refined petroleum products, chemicals and pharmaceutical products in basic chemicals. Monthly changes in production should be interpreted with caution due to random variations in the production in Norwegian manufacturing.
Norway and the euro area
There was a 2.4 per cent increase in Norwegian manufacturing output from May 2009 to May 2010, according to working-day adjusted figures. Industrial production in the euro area increased by 9.8 per cent in the same period, according to figures published by Eurostat .
| Adjusted for working-days1 | Seasonally adjusted | ||||||||||||||||||||||||||||||||||||||||||||||||||||||||||||||||||||||||||||||
|---|---|---|---|---|---|---|---|---|---|---|---|---|---|---|---|---|---|---|---|---|---|---|---|---|---|---|---|---|---|---|---|---|---|---|---|---|---|---|---|---|---|---|---|---|---|---|---|---|---|---|---|---|---|---|---|---|---|---|---|---|---|---|---|---|---|---|---|---|---|---|---|---|---|---|---|---|---|---|---|
| June 2009- June 2010 |
January 2009-June 2009- January 2010-June 2010 |
May 2010- June 2010 |
January 2010-March 2010- April 2010-June 2010 |
||||||||||||||||||||||||||||||||||||||||||||||||||||||||||||||||||||||||||||
| The overall index | -4.4 | -4.0 | -1.7 | -2.4 | |||||||||||||||||||||||||||||||||||||||||||||||||||||||||||||||||||||||||||
| Oil and Gas Extraction | -8.0 | -6.1 | -3.6 | -2.8 | |||||||||||||||||||||||||||||||||||||||||||||||||||||||||||||||||||||||||||
| Manufacturing | 7.2 | 2.0 | 3.3 | 1.1 | |||||||||||||||||||||||||||||||||||||||||||||||||||||||||||||||||||||||||||
| Electricity, Gas and Steam Supply | -13.6 | -4.9 | -4.1 | -16.6 | |||||||||||||||||||||||||||||||||||||||||||||||||||||||||||||||||||||||||||
| Main industrial groupings | |||||||||||||||||||||||||||||||||||||||||||||||||||||||||||||||||||||||||||||||
| Intermediate goods | 9.1 | 3.3 | 1.5 | 1.5 | |||||||||||||||||||||||||||||||||||||||||||||||||||||||||||||||||||||||||||
| Capital goods | 2.3 | -1.2 | 1.6 | 0.6 | |||||||||||||||||||||||||||||||||||||||||||||||||||||||||||||||||||||||||||
| Consumer goods | 6.3 | -0.1 | 1.5 | -0.3 | |||||||||||||||||||||||||||||||||||||||||||||||||||||||||||||||||||||||||||
| Energy goods | -8.2 | -7.1 | -2.4 | -3.4 | |||||||||||||||||||||||||||||||||||||||||||||||||||||||||||||||||||||||||||
| 1 | Adjusted for working-days and for public holidays in Norway. |
Tables
Contact
-
Production and turnover
E-mail: prodoms@ssb.no


