Content
Published:
This is an archived release.
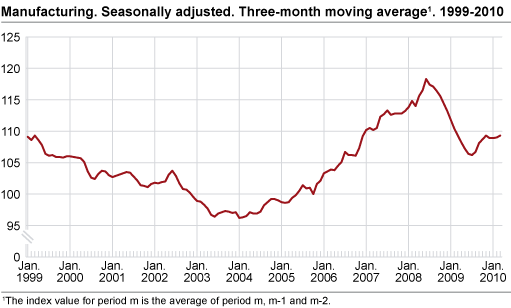
Minor changes in manufacturing
Production in manufacturing increased by 0.4 per cent in the first quarter of 2010 compared to the last quarter of 2009, according to seasonally adjusted figures.
The output in basic metals and basic chemicals had significant growth in this last period due to increased demand from abroad. Wood and wood products also saw an increase in the first quarter of 2010 after minor changes during the previous quarters. On the contrary, the output in food products was reduced by 1.3 per cent in the first quarter of 2010 compared with the last quarter of 2009.
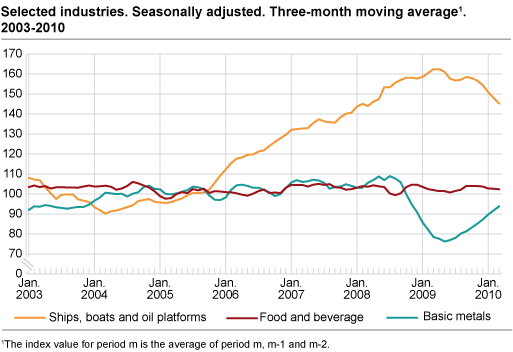
Ships, boats and oil platforms
The production in ships, boats and oil platforms went down by 6.0 per cent in the first quarter of 2010 compared with the last quarter of 2009, according to seasonally adjusted figures. A significant drop in stock of unfilled orders as well as a decrease in new orders have contributed to this downturn (see Statistics on new orders 1st quarter 2010 ).
From March 2009 to March 2010
Output in Norwegian manufacturing increased by 1.6 per cent from March 2009 to March 2010, according to working-day adjusted figures. There was significant growth in the production in basic metals and basic chemicals, while output in ships, boats and oil platforms went down by 12.6 per cent.
From February to March 2010
Production in manufacturing had a 0.4 per cent growth from February to March 2010, according to seasonally adjusted figures. Food products as well as basic metals saw an increase in the production, while the output in ships, boats and oil platforms decreased.
Norway and the euro area
There was a 0.2 per cent decrease in Norwegian manufacturing output from February 2009 to February 2010, according to working-day adjusted figures. Industrial production in the euro area increased by 4.3 per cent in the same period, according to figures published by Eurostat .
| Adjusted for working-days1 | Seasonally adjusted | ||||||||||||||||||||||||||||||||||||||||||||||||||||||||||||||||||||||||||||||
|---|---|---|---|---|---|---|---|---|---|---|---|---|---|---|---|---|---|---|---|---|---|---|---|---|---|---|---|---|---|---|---|---|---|---|---|---|---|---|---|---|---|---|---|---|---|---|---|---|---|---|---|---|---|---|---|---|---|---|---|---|---|---|---|---|---|---|---|---|---|---|---|---|---|---|---|---|---|---|---|
| Mar. 2009- Mar. 2010 | Jan.09- Mar.09-Jan.10- Mar.10 | Feb. 2010-Mar. 2010 | Oct.09-Dec.09- Jan.10-Mar.10 | ||||||||||||||||||||||||||||||||||||||||||||||||||||||||||||||||||||||||||||
| The overall index | -5.0 | -4.8 | -1.8 | -1.0 | |||||||||||||||||||||||||||||||||||||||||||||||||||||||||||||||||||||||||||
| Oil and Gas Extraction | -7.0 | -7.2 | -1.6 | -0.6 | |||||||||||||||||||||||||||||||||||||||||||||||||||||||||||||||||||||||||||
| Manufacturing | 1.6 | -0.1 | 0.4 | 0.4 | |||||||||||||||||||||||||||||||||||||||||||||||||||||||||||||||||||||||||||
| Electricity, Gas and Steam Supply | -10.2 | 0.2 | -13.4 | -7.9 | |||||||||||||||||||||||||||||||||||||||||||||||||||||||||||||||||||||||||||
| Main industrial groupings | |||||||||||||||||||||||||||||||||||||||||||||||||||||||||||||||||||||||||||||||
| Intermediate goods | 4.0 | -1.0 | -3.9 | 0.8 | |||||||||||||||||||||||||||||||||||||||||||||||||||||||||||||||||||||||||||
| Capital goods | -0.7 | -1.4 | 0.3 | -0.5 | |||||||||||||||||||||||||||||||||||||||||||||||||||||||||||||||||||||||||||
| Consumer goods | 1.4 | -1.0 | 0.7 | -0.7 | |||||||||||||||||||||||||||||||||||||||||||||||||||||||||||||||||||||||||||
| Energy goods | -8.2 | -6.2 | -1.9 | -0.7 | |||||||||||||||||||||||||||||||||||||||||||||||||||||||||||||||||||||||||||
| 1 | Adjusted for working-days and for public holidays in Norway. |
Tables
Contact
-
Production and turnover
E-mail: prodoms@ssb.no