Content
Published:
This is an archived release.
Small decline in manufacturing
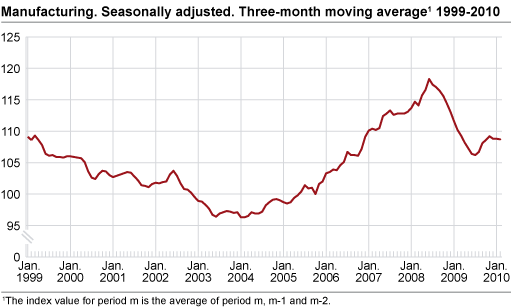
Production in manufacturing went down by 0.5 per cent in December 2009 to February 2010 compared with the previous three-month period, according to seasonally adjusted figures.
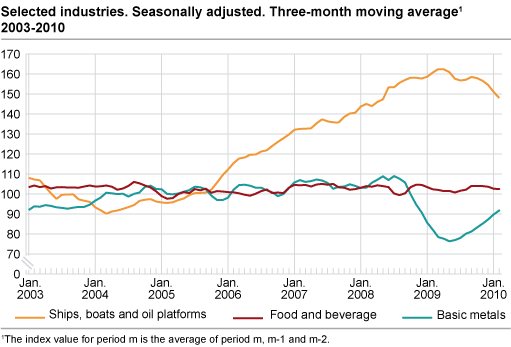
Output in ships, boats and oil platforms went down by 5.5 per cent during this period. A significant drop in stock of unfilled orders as well as a decrease in new orders in 2009 has contributed to this downturn (see Statistics on new orders 4t h quarter 2009 ). Production in this sector has dropped 10 per cent since it peaked in March 2009. Output in food and beverage went down by 1.4 per cent in December 2009 to February 2010 compared with the previous three months. Food and beverage is the largest industry within manufacturing, covering 17 per cent. This decline in production was partly due to lower activity in the slaughterhouse industry during periods of cold weather.
Increasing output in basic metals and basic chemicals
Production in basic metals increased by 7.8 per cent in December 2009 to February 2010 compared with the previous three-month period. The financial crisis had a significant impact on this sector, but production has increased by 24 per cent since May 2009. Nevertheless, output in basic metals is significantly lower than before the onset of the financial crisis. Production in basic chemicals has also increased considerably. In the last three-month period, output in basic chemicals went up by 12.3 per cent.
From January to February 2010
Output in manufacturing increased by 0.8 per cent from January to February 2010, according to seasonally adjusted figures. This upturn is partly due to a 1.6 per cent increase in the production of food and beverage. Basic chemicals went up by 7.6 per cent, while rubber, plastic and mineral products saw an increase of 6.8 per cent after a long period of decline in output.
From February 2009 to February 2010
Output in Norwegian manufacturing increased by 0.2 per cent from February 2009 to February 2010, according to working-day adjusted figures. There was a significant growth in the production in basic metals, basic chemicals and paper and paper products, while output in ships and oil platforms dropped by 9.7 per cent.
Norway and the euro area
There was a 2.0 per cent decrease in Norwegian manufacturing output from January 2009 to January 2010, according to working-day adjusted figures. Industrial production in the euro area increased by 1.4 per cent in the same period according to figures published by Eurostat .
| Adjusted for working-days1 | Seasonally adjusted | ||||||||||||||||||||||||||||||||||||||||||||||||||||||||||||||||||||||||||||||
|---|---|---|---|---|---|---|---|---|---|---|---|---|---|---|---|---|---|---|---|---|---|---|---|---|---|---|---|---|---|---|---|---|---|---|---|---|---|---|---|---|---|---|---|---|---|---|---|---|---|---|---|---|---|---|---|---|---|---|---|---|---|---|---|---|---|---|---|---|---|---|---|---|---|---|---|---|---|---|---|
| February 2009- February 2010 |
December 2008-February 2009- December 2009-February 2010 |
January 2010- February 2010 |
September 2009-November 2009- December 2009-February 2010 |
||||||||||||||||||||||||||||||||||||||||||||||||||||||||||||||||||||||||||||
| The overall index | -6.2 | -5.3 | -0.5 | -0.5 | |||||||||||||||||||||||||||||||||||||||||||||||||||||||||||||||||||||||||||
| Oil and Gas Extraction | -9.6 | -7.5 | -0.5 | -0.3 | |||||||||||||||||||||||||||||||||||||||||||||||||||||||||||||||||||||||||||
| Manufacturing | 0.2 | -1.4 | 0.8 | -0.5 | |||||||||||||||||||||||||||||||||||||||||||||||||||||||||||||||||||||||||||
| Electricity, Gas and Steam Supply | 2.7 | 3.3 | -5.1 | -0.4 | |||||||||||||||||||||||||||||||||||||||||||||||||||||||||||||||||||||||||||
| Main industrial groupings | |||||||||||||||||||||||||||||||||||||||||||||||||||||||||||||||||||||||||||||||
| Intermediate goods | -7.6 | -3.7 | 1.8 | 1.7 | |||||||||||||||||||||||||||||||||||||||||||||||||||||||||||||||||||||||||||
| Capital goods | -1.5 | -1.9 | 0.3 | -1.2 | |||||||||||||||||||||||||||||||||||||||||||||||||||||||||||||||||||||||||||
| Consumer goods | -0.3 | -2.0 | 1.5 | -0.9 | |||||||||||||||||||||||||||||||||||||||||||||||||||||||||||||||||||||||||||
| Energy goods | -7.3 | -5.9 | -2.2 | 0.1 | |||||||||||||||||||||||||||||||||||||||||||||||||||||||||||||||||||||||||||
| 1 | Adjusted for working-days and for public holidays in Norway. |
Seasonally adjusted three-month moving averageSeasonally adjusted three-month moving average for all series is now available in the StatBank. Three-month moving average is used to minimise the effect of random variation in monthly figures in order to give a better description of current economic trends. The three-month moving average index number is the average of the three previous monthly index numbers. For example: three-month moving average for February is the average monthly index numbers for February, January and December. |
Tables
Contact
-
Production and turnover
E-mail: prodoms@ssb.no


