Content
Published:
This is an archived release.
Significant drop in manufacturing
The output in manufacturing went down 6.2 per cent from 2008 to 2009, according to working-day adjusted figures.
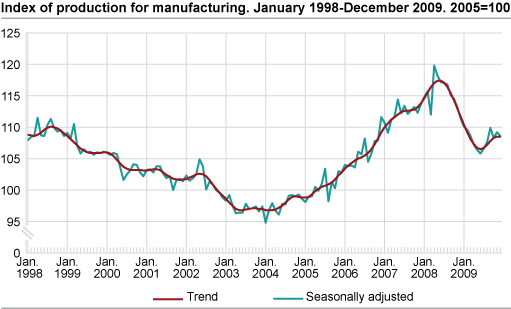
Falling demand, especially from abroad, in 2009 brought this severe downturn in the industrial production (see External merchandise trade ). From the autumn of 2009, the output in manufacturing saw some improvements. The production then rose by 1.4 per cent from the second to the third quarter and further by 0.6 per cent from the third to fourth quarter of 2009, according to seasonally adjusted figures. The average capacity utilisation in manufacturing was still on a low level in the fourth quarter of 2009 ( See Business tendency survey, 4th quarter 2009 ). However, there were great variations within manufacturing.
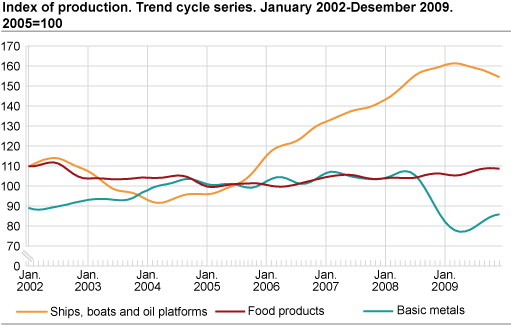
Slump in basic metals
The production in basic metals dropped by 20.8 per cent in 2009 compared with 2008, according to working-day adjusted figures. In the third and the fourth quarter of 2009 the output in basic metals has seen a 4.9 per cent and 6.2 per cent growth, according to seasonally adjusted figures. The output in basic metals was still lower in the fourth quarter of 2009 than in the same period of 2008.
Stock of unfilled orders
Due to the stock of unfilled orders, especially to the Norwegian oil and gas sector, the output in ships, boats and oil platforms, machinery and equipment as well as repair and installation of machinery went up in 2009 compared with 2008. Statistics on new orders for the third quarter of 2009 show that these stocks were significantly reduced in this period.
Increase in food products
The production in food products increased by 1.5 per cent in 2009 compared with 2008. This was mostly due a strong upturn in the export of fish and fish products in 2009. The output in food products was almost unchanged from the third to the fourth quarter of 2009, according to seasonally adjusted figures.
From November to December 2009
The output in manufacturing decreased by 0.5 per cent from November to December 2009, according to seasonally adjusted figures. The production in basic chemicals saw a 2.9 per cent growth. Engineering industry, wood and wood products as well as paper and paper products had a drop in the output.
Norway and the Euro Area
The Norwegian manufacturing output decreased by 3.3 per cent from November 2008 to November 2009, according to working-day adjusted figures. Industrial production in the Euro area dropped 7.0 per cent in the same period, according to figures published by Eurostat.
| Adjusted for working-days 1 | Seasonally adjusted | ||||||||||||||||||||||||||||||||||||||||||||||||||||||||||||||||||||||||||||||
|---|---|---|---|---|---|---|---|---|---|---|---|---|---|---|---|---|---|---|---|---|---|---|---|---|---|---|---|---|---|---|---|---|---|---|---|---|---|---|---|---|---|---|---|---|---|---|---|---|---|---|---|---|---|---|---|---|---|---|---|---|---|---|---|---|---|---|---|---|---|---|---|---|---|---|---|---|---|---|---|
| December 2008- December 2009 | January 2008-December 2008- January 2009-December 2009 | November 2009- December 2009 | July 2009-September 2009- October 2009-December 2009 | ||||||||||||||||||||||||||||||||||||||||||||||||||||||||||||||||||||||||||||
| The overall index | -6.5 | -3.6 | -0.5 | 0.4 | |||||||||||||||||||||||||||||||||||||||||||||||||||||||||||||||||||||||||||
| Oil and Gas Extraction | -7.8 | -2.6 | -0.9 | -0.3 | |||||||||||||||||||||||||||||||||||||||||||||||||||||||||||||||||||||||||||
| Manufacturing | -2.6 | -6.2 | -0.5 | 0.6 | |||||||||||||||||||||||||||||||||||||||||||||||||||||||||||||||||||||||||||
| Electricity, Gas and Steam Supply | -0.2 | -7.5 | 5.0 | 13.0 | |||||||||||||||||||||||||||||||||||||||||||||||||||||||||||||||||||||||||||
| Main industrial groupings | |||||||||||||||||||||||||||||||||||||||||||||||||||||||||||||||||||||||||||||||
| Intermediate goods | -4.8 | -8.2 | -4.7 | 8.6 | |||||||||||||||||||||||||||||||||||||||||||||||||||||||||||||||||||||||||||
| Capital goods | -1.7 | 1.7 | -1.1 | -0.4 | |||||||||||||||||||||||||||||||||||||||||||||||||||||||||||||||||||||||||||
| Consumer goods | -1.4 | -5.9 | 1.5 | -0.1 | |||||||||||||||||||||||||||||||||||||||||||||||||||||||||||||||||||||||||||
| Energy goods | -7.2 | -3.1 | -0.2 | -1.0 | |||||||||||||||||||||||||||||||||||||||||||||||||||||||||||||||||||||||||||
| 1 | Adjusted for working-days and for moving holidays. |
Tables
Contact
-
Production and turnover
E-mail: prodoms@ssb.no