Content
Published:
This is an archived release.
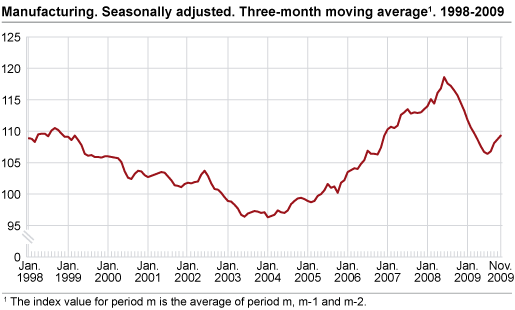
Improvements for manufacturing
Industrial production went up 2.3 per cent from September to November 2009 compared to June to August 2009, according to seasonally-adjusted figures.

Refined petroleum, chemical and pharmaceutical products contributed to the growth within manufacturing with a 10.8 per cent increase in the production. This is the second most significant aggregate within manufacturing and represents approximately 12.5 per cent of the total output. Basic chemicals went up 16.5 per cent in the same period, partly due to further growth in the solar industry.
Basic metals and food products
The improvements in manufacturing have also been provided by basic metals, which experienced a 4.9 per cent growth from September to November 2009 compared with the previous three months. However, the output in basic metals was still significantly lower than before the financial crisis in 2008. Food products also saw a 2.1 per cent increase from September to November 2009 compared to the previous months.
Ships, boats and oil platforms
The output in ships, boats and oil platforms was almost unchanged from September to November 2009 compared with June to August 2009, according to seasonally-adjusted figures. Due to the stocks of unfilled orders, the industries related to ships, boats and oil platforms were able to maintain a substantial level of activity. However, according to Statistics on new orders for the third quarter of 2009 these stocks are in significant decline due to a downturn in new orders received.
From October to November 2009
Industrial production increased by 0.9 per cent from October to November 2009, according to seasonally-adjusted figures. The output in refined petroleum, chemical and pharmaceutical products went up 3.9 per cent together with a 1.5 per cent growth in basic metals. Wood and wood products and ships, boats and oil platforms saw a drop in production of 1.4 per cent and 0.6 per cent respectively.
From November 2008 to November 2009
Output in manufacturing decreased by 3.3 per cent from November 2008 to November 2009, according to working-day adjusted figures. Fabricated metal products, computer and electrical equipment together with transport equipment n.e.c had a significant drop in output. Machinery and equipment n.e.c saw a 1.5 per cent growth in production.
Norway and the Euro area
The Norwegian manufacturing output decreased by 5.3 per cent from October 2008 to October 2009, according to working-day adjusted figures. Industrial production in the Euro area dropped 11.5 per cent in the same period, according to figures published by Eurostat.
| Adjusted for working-days 1 | Seasonally adjusted | ||||||||||||||||||||||||||||||||||||||
|---|---|---|---|---|---|---|---|---|---|---|---|---|---|---|---|---|---|---|---|---|---|---|---|---|---|---|---|---|---|---|---|---|---|---|---|---|---|---|---|
| November 2008- November 2009 | January 2008-November 2008- January 2009-November 2009 | October 2009- November 2009 | June 2009-August 2009- September 2009-November 2009 | ||||||||||||||||||||||||||||||||||||
| The overall index | -4.3 | -3.2 | 0.5 | 1.4 | |||||||||||||||||||||||||||||||||||
| Oil and Gas Extraction | -5.4 | -2.0 | 1.1 | 0.0 | |||||||||||||||||||||||||||||||||||
| Manufacturing | -3.3 | -6.5 | 0.9 | 2.3 | |||||||||||||||||||||||||||||||||||
| Electricity, Gas and Steam Supply | -4.1 | -8.4 | -9.8 | 19.3 | |||||||||||||||||||||||||||||||||||
| Main industrial groupings | |||||||||||||||||||||||||||||||||||||||
| Intermediate goods | 6.0 | -8.4 | 5.6 | 10.2 | |||||||||||||||||||||||||||||||||||
| Capital goods | -0.1 | 2.1 | 0.2 | 1.0 | |||||||||||||||||||||||||||||||||||
| Consumer goods | -5.4 | -6.3 | -0.8 | 2.4 | |||||||||||||||||||||||||||||||||||
| Energy goods | -7.0 | -2.8 | 0.5 | -1.0 | |||||||||||||||||||||||||||||||||||
| 1 | Adjusted for working-days and for moving holidays. |
Tables
Contact
-
Production and turnover
E-mail: prodoms@ssb.no