Content
Published:
This is an archived release.
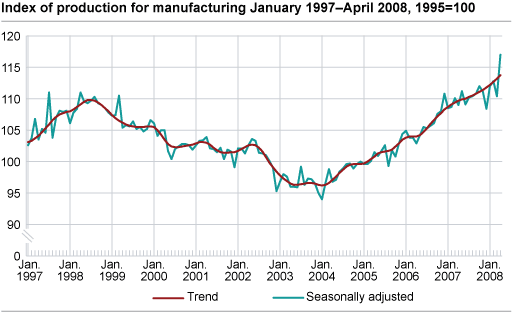
Growth in manufacturing output
Output in Norwegian manufacturing rose by 2.6 per cent from February to April compared with the previous three-month period, according to seasonally adjusted figures.
Capital goods output rose by 5.1 per cent, mainly due to growth in oil platforms, machinery equipment and fabricated metal products. Transport equipment and electrical and optical equipment also contributed to the increase. This means that the positive development within capital goods output continued due to the favourable order situation and high investments in recent years.
Intermediate and consumer goods output
There was a 2.6 per cent increase in intermediate goods output from February to April compared with the previous three-month period. The main contributor to this increase was other non-metallic mineral products. Basic metals and rubber and plastic products also experienced a rise in output, while the output in wood and wood products declined.
Output in consumer goods fell by 0.3 per cent from February to April compared with the previous three-month period. Food products have seen a modest increase while publishing and printing and reproduction fell.
Increase since April 2007
There was a 7.5 per cent increase in manufacturing output from April 2007 to April 2008, according to working-day adjusted figures. The capital goods output has risen by 16.7 per cent in this period, while intermediate and consumer goods output has risen by 5.7 and 5.9 per cent respectively.
Oil platforms and seasonal adjustment
Because of a moderate adjustment in method, the seasonally adjusted figures for oil platforms in March are higher than the figures published last month.
Norway and the euro area
According to working-day adjusted figures there was a 0.1 per cent increase in Norwegian manufacturing output from March 2007 to March 2008. Industrial production in the euro area rose by 0.2 per cent in the same period, according to figures published by Eurostat .
| Adjusted for working-days 1 | Seasonally adjusted | ||||||||||||||||||||||||||||||||||||||
|---|---|---|---|---|---|---|---|---|---|---|---|---|---|---|---|---|---|---|---|---|---|---|---|---|---|---|---|---|---|---|---|---|---|---|---|---|---|---|---|
| April 2007-April 2008 | January 2007-April 2007- January 2008-April 2008 | March 2008-April 2008 | November 2007-January 2008- February 2008-April 2008 | ||||||||||||||||||||||||||||||||||||
| The overall index | -4.4 | 0.0 | -2.4 | 0.7 | |||||||||||||||||||||||||||||||||||
| Oil and Gas Extraction | -10.8 | -2.2 | -6.5 | 0.1 | |||||||||||||||||||||||||||||||||||
| Manufacturing | 7.5 | 3.6 | 6.0 | 2.6 | |||||||||||||||||||||||||||||||||||
| Electricity, Gas and Steam Supply | 11.6 | 10.8 | 3.4 | 3.7 | |||||||||||||||||||||||||||||||||||
| Main industrial groupings | |||||||||||||||||||||||||||||||||||||||
| Intermediate goods | 5.7 | -0.2 | 7.4 | 2.6 | |||||||||||||||||||||||||||||||||||
| Capital goods | 16.7 | 12.2 | 8.4 | 5.1 | |||||||||||||||||||||||||||||||||||
| Consumer goods | 5.9 | 1.2 | 4.8 | -0.3 | |||||||||||||||||||||||||||||||||||
| Energy goods | -8.0 | -0.7 | -6.8 | 0.2 | |||||||||||||||||||||||||||||||||||
| 1 | Adjusted for working-days and for moving holidays. |
Tables
Contact
-
Production and turnover
E-mail: prodoms@ssb.no