Content
Published:
This is an archived release.
Sector differences
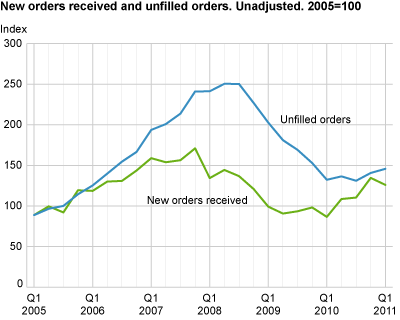
New orders in the manufacturing industry decreased by 6 per cent from the fourth quarter of 2010 to the first quarter of 2011, but have increased by 45 per cent since the first quarter of 2010. Unfilled orders in the industry were up by 4 per cent from the fourth quarter of 2010 to the first quarter of 2011.
The reduction in the new orders received from the fourth quarter of 2010 to the first quarter of 2011 must be viewed in light of the pronounced increase in the new orders received through 2010. Accumulations of orders that have not been effectuated therefore give a moderate growth in the unfilled orders.
| Change from last quarter (per cent) Q4 2010-Q1 2011 |
Change from last year (per cent) Q1 2010-Q1 2011 |
Indices of value Q1 2011 |
|||||||||||||||||||||||||||||||||||||||||||||||||||||||||||||||||||||||||||||
|---|---|---|---|---|---|---|---|---|---|---|---|---|---|---|---|---|---|---|---|---|---|---|---|---|---|---|---|---|---|---|---|---|---|---|---|---|---|---|---|---|---|---|---|---|---|---|---|---|---|---|---|---|---|---|---|---|---|---|---|---|---|---|---|---|---|---|---|---|---|---|---|---|---|---|---|---|---|---|---|
| New orders received | |||||||||||||||||||||||||||||||||||||||||||||||||||||||||||||||||||||||||||||||
| Total | -6.4 | 45.4 | 126.0 | ||||||||||||||||||||||||||||||||||||||||||||||||||||||||||||||||||||||||||||
| Domestic market | 24.9 | 67.4 | 121.2 | ||||||||||||||||||||||||||||||||||||||||||||||||||||||||||||||||||||||||||||
| Export market | -23.9 | 29.8 | 130.7 | ||||||||||||||||||||||||||||||||||||||||||||||||||||||||||||||||||||||||||||
| Chemical and pharmaceutical products | -41.6 | -3.8 | 130.8 | ||||||||||||||||||||||||||||||||||||||||||||||||||||||||||||||||||||||||||||
| Basic metals | 7.7 | 38.4 | 127.6 | ||||||||||||||||||||||||||||||||||||||||||||||||||||||||||||||||||||||||||||
| Machinery and equipment | -15.8 | 98.1 | 143.6 | ||||||||||||||||||||||||||||||||||||||||||||||||||||||||||||||||||||||||||||
| Ships, boats and oil platforms | 31.6 | 150.7 | 119.5 | ||||||||||||||||||||||||||||||||||||||||||||||||||||||||||||||||||||||||||||
| Unfilled orders | |||||||||||||||||||||||||||||||||||||||||||||||||||||||||||||||||||||||||||||||
| Total | 3.7 | 10.2 | 145.8 | ||||||||||||||||||||||||||||||||||||||||||||||||||||||||||||||||||||||||||||
| Domestic market | 16.6 | 16.0 | 120.5 | ||||||||||||||||||||||||||||||||||||||||||||||||||||||||||||||||||||||||||||
| Export market | -4.3 | 6.3 | 173.0 | ||||||||||||||||||||||||||||||||||||||||||||||||||||||||||||||||||||||||||||
| Chemical and pharmaceutical products | -18.0 | 19.6 | 250.2 | ||||||||||||||||||||||||||||||||||||||||||||||||||||||||||||||||||||||||||||
| Basic metals | 14.4 | 20.9 | 87.9 | ||||||||||||||||||||||||||||||||||||||||||||||||||||||||||||||||||||||||||||
| Machiney and equipment | -1.7 | -14.0 | 214.6 | ||||||||||||||||||||||||||||||||||||||||||||||||||||||||||||||||||||||||||||
| Ships, boats and oil platforms | 13.7 | 33.2 | 123.7 | ||||||||||||||||||||||||||||||||||||||||||||||||||||||||||||||||||||||||||||
From industry to extraction areas:Several enterprises have been reclassified from manufacturing to service activities in the central register of establishments and enterprises. These enterprises are therefore no longer included in the statistics. To improve the comparison with previous periods, these enterprises have been removed from the population, and the statistics on new orders have been recalculated for 2010. Read more about the changes in the annual statistics for oil and gas activity .
New method for grossing up:From the first quarter of 2011, a new method of grossing up is being used for statistics on new orders. The sample data are inflated to population level using a ratio estimator. The ratio estimator uses turnover figures from the Manufacturing statistics, structural data as auxiliary variables. Turnover figures from the VAT register were previously used as auxiliary variables. |
Tables
Contact
-
Statistics Norway's Information Centre
E-mail: informasjon@ssb.no
tel.: (+47) 21 09 46 42

