Content
Published:
This is an archived release.
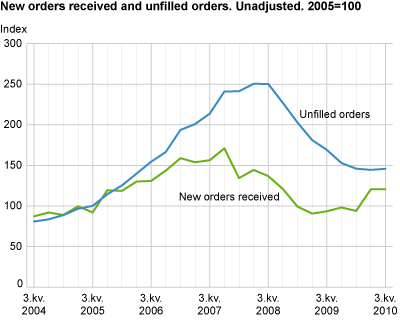
Unchanged new orders in industry
Total stocks in industry increased by just 1 per cent in the third quarter of 2010 compared to the second quarter this year. Meanwhile stocks of new orders were unchanged. This showed that the tendency for both indicators has levelled out.
Some industries showed a clear improvement in acquisition of new contracts. A good example is the industry related to building of ships, boats and oil platforms. New orders jumped 52 per cent from the second quarter to the third quarter this year. At the same time, stocks of orders increased 25 per cent in the same period.
Among industries with weaker results were machinery and equipment. The decline was in both new orders and stocks of orders, down 26 per cent and 17 per cent respectively. In addition, basic chemicals fell by 12 per cent in new orders, while stocks of orders were reduced by 26 per cent from the second quarter to the third quarter this year. The Norwegian solar industry contributed strongly to this result.
Higher level of new orders compared to the third quarter 2009
New orders showed an increase of 29 per cent from the third quarter 2009 to the same quarter this year. This rise was significant within the domestic market, up 61 per cent, while the export market went up by 8 per cent. The development was especially positive within the industries basic metals, building of ships, boats and oil platforms and repair, installation and machinery. Conversely, industries that pulled the index for new orders down were fabricated metal products and chemical and pharmaceutical products, down 23 and 12 per cent respectively.
Total stocks in industry decreased by 14 per cent compared to the third quarter last year.
| Industrial Classification | New orders received (trend)1 | Unfilled orders (original series) Q3 2009-Q3 2010 |
|||||||||||||||||||||||||||||||||||||||||||||||||||||||||||||||||||||||||||||
|---|---|---|---|---|---|---|---|---|---|---|---|---|---|---|---|---|---|---|---|---|---|---|---|---|---|---|---|---|---|---|---|---|---|---|---|---|---|---|---|---|---|---|---|---|---|---|---|---|---|---|---|---|---|---|---|---|---|---|---|---|---|---|---|---|---|---|---|---|---|---|---|---|---|---|---|---|---|---|---|
| Q1 2010- Q2 2010 |
Q2 2010- Q3 2010 |
||||||||||||||||||||||||||||||||||||||||||||||||||||||||||||||||||||||||||||||
| Total | 24.6 | 19.0 | -13.8 | ||||||||||||||||||||||||||||||||||||||||||||||||||||||||||||||||||||||||||||
| Basic Chemicals | -1.9 | -7.5 | -25.2 | ||||||||||||||||||||||||||||||||||||||||||||||||||||||||||||||||||||||||||||
| Basic Metals | 25.3 | 13.6 | 15.2 | ||||||||||||||||||||||||||||||||||||||||||||||||||||||||||||||||||||||||||||
| Machinery and Equipment | 19.3 | 13.1 | -45.4 | ||||||||||||||||||||||||||||||||||||||||||||||||||||||||||||||||||||||||||||
| Ships, boats and oil plattforms | 91.9 | 58.4 | 18.3 | ||||||||||||||||||||||||||||||||||||||||||||||||||||||||||||||||||||||||||||
| 1 | Estimated annual changes in trend series, based on change in percentage from previous quarter, converted to annual growth. |
Extended release of results in the StatBank:The coverage in the Statbank is extended from the release of results for the Statistics on new orders in the third quarter of 2010. One new table is available:
08186: Statistics on new orders
The new table also covers results from the former table in the Statbank: 07103: Statistics on new orders, SIC2007. This table is therefore removed. |
Tables
Contact
-
Statistics Norway's Information Centre
E-mail: informasjon@ssb.no
tel.: (+47) 21 09 46 42