Content
Published:
This is an archived release.
Pronounced decline in new orders
More and more establishments are being affected by poorer demand. A high level of stocks within some industries is helping to soften the decline in the total level of activity.
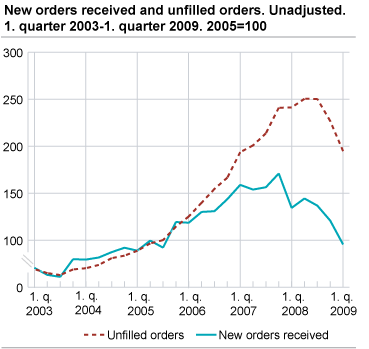
Manufacturers working on new orders reported a considerable fall in the new orders received. New orders received were 28.9 per cent lower in the first quarter of 2009 than in the corresponding quarter last year and can be said to be an average historically. Total stocks showed a similar course, but with a smaller decline. From the first quarter of 2008 to the first quarter of 2009, total stocks were down by 19.3 per cent. However, there are some industries (machine industry, building of boats and oil platforms) that have large enough stocks to maintain a high production volume ( Index of production ).
| Industrial Classification | New orders received (trend)1 | Unfilled orders (original series) Q1 2008-Q1 2009 |
|||||||||||||||||||||||||||||||||||||
|---|---|---|---|---|---|---|---|---|---|---|---|---|---|---|---|---|---|---|---|---|---|---|---|---|---|---|---|---|---|---|---|---|---|---|---|---|---|---|---|
| Q3 2008- Q4 2008 |
Q4 2008- Q1 2009 |
||||||||||||||||||||||||||||||||||||||
| Total | -31.7 | -25.4 | -19.3 | ||||||||||||||||||||||||||||||||||||
| Basic Chemicals | -35.9 | -28.4 | -34.8 | ||||||||||||||||||||||||||||||||||||
| Basic Metals | -33.3 | -25.3 | -61.1 | ||||||||||||||||||||||||||||||||||||
| Machinery and Equipment | -35.6 | -36.3 | 2.7 | ||||||||||||||||||||||||||||||||||||
| Ships, boats and oil plattforms | -29.0 | -2.8 | -34.4 | ||||||||||||||||||||||||||||||||||||
| 1 | Estimated annual changes in trend series, based on change in percentage from previous quarter, converted to annual growth. |
Important announcement: New industry classificationAs from the first quarter of 2009, a new version of Eurostat's industry classification, NACE, will be in use. Statistics on new orders are affected by the change of nomenclature from the publication of the first quarter of 2009 results. Click here to read more about the implications for users, calculation and dissemination. |
Tables
Contact
-
Statistics Norway's Information Centre
E-mail: informasjon@ssb.no
tel.: (+47) 21 09 46 42