Content
Published:
This is an archived release.
Marked upswing in value added
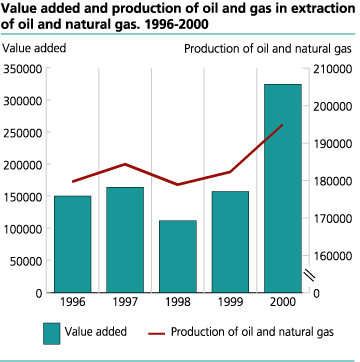
The value added in the oil industries increased by 91.4 per cent, NOK 345.5 billion from 1999 to 2000.The rise is mainly a result of a rise in oil prices and an increase in overall petroleum production of 12,7 million tonnes or 7 per cent. The value added is determined by the three factors: production, prices and intermediate consumption.
The oil industries include operators' and licensees' activities related to the extraction and pipeline transport of crude oil and natural gas plus services and contract drilling
The extraction of oil and natural gas was above all the reason for the considerable increase in the oil industries value added from 1999 to 2000. In the extraction of oil and natural gas the value added rose by NOK 167.1 billion or 105.8 per cent. While services related to the oil and gas industry decreased by 25.3 per cent, pipeline transport of crude oil and natural gas increased by NOK 0.1 billion.
Sales value twice as high
In 2000 the sales value of oil and gas production was calculated to NOK 348.8 billion. This represents a rise of 100.1 per cent compared with 1999. Higher prices of crude oil, NGL (Natural Gas liquids) and condensate contributed to the increase in sales value. From 1999 to 2000 the selling price of crude oil, NGL and condensate rose by 76.4 per cent, 92.3 per cent and 60.5 per cent respectively. The price of natural gas increased by 45.8 per cent.
Decline in intermediate consumption
The intermediate consumption in the oil industries went down by 2.11 per cent to NOK 39.71 billion in 2000. This is a fall of NOK 8331 million compared with 1999. The intermediate consumption in the producing oil and gas fields amounts to NOK 20.3 billion. From 1999 to 2000 this represents a rise of NOK 2.5 billion or 13.8 per cent. The rise is mainly due to an increase of the rental of operating equipment, maintenance and cost to own employees.
Lower Employment
In 2000 22 026 persons occupied the oil industries, excluding pipeline transport of oil and gas. This is a decline of 3 054 employees or 12.2 per cent. Accordingly the year 2000 had the lowest level of employment since 1996.
A marked reduction of employees in both services associated with oil and gas industries and in extraction of oil and natural gas has taken place.
The wage costs, including social benefits, decreased by 2.6 per cent from 1999 to 2000. While wage costs in extraction of oil and natural gas industries experienced a minimal rise of 0.3 per cent, the wage costs in services related to the oil and gas industries fell by 9.3 per cent.
On average, the yearly wages per employee where NOK 748 000 in the oil and gas industries in 2000 - which is an increase of 10.8 per cent compared with 1999.
| 1 | The figures were corrected 10 November 2004. |
Tables:
- Table 1 Principal figures for extraction of crude oil and natural gas. 1996-2000. (Corrected 10 November 2004.)
- Table 2 Intermediate consumption for fields on stream. 1996-2000. Million NOK
- Table 3 Principal figures for service activities incidental to oil and gas extraction excluding surveying. 1996-2000
- Table 4 Principal figures for transport via pipelines. 1996-2000. Million NOK
Additional information
Contact
-
Maria Asuncion Campechano
E-mail: maria.campechano@ssb.no
tel.: (+47) 40 81 14 21
-
August Meland
E-mail: august.meland@ssb.no
tel.: (+47) 46 42 33 21

