Content
Published:
This is an archived release.
Increasing oil prices led to good results
The operating income for the oil companies increased by NOK 93 billion1 to NOK 497 billion1 in 2004, as a consequence of increased oil prices. This also caused a rise in operating income of NOK 44 billion.
Average oil price per barrel increased from 28.7 dollar1 to 38.1 dollar1 in 2004, and contributed strongly to the increase in operating income of 23.1 per cent1. The operating result increased to NOK 179 billion, from NOK 134 billion in 2003. The annual profit increased to NOK 69 billion1.
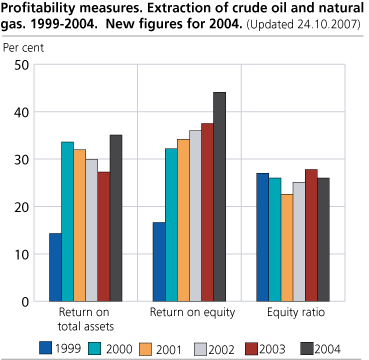
The average return on total assets increased from 27.3 per cent in 2003 to 35.1 per cent1 in 2004. In the previous years the return on total assets has decreased due to increase in equity. Also in 2004, equity increased, but due to the high operating profit, average return on assets increased. In addition, the oil companies had large financial income from dividends and reduced interest rates.
Average return on equity increased from 37.5 to 44.1 per cent. This is partly explained by the increase in ordinary result, and partly by a decrease in the equity ratio.
Total capital increased - reduced financial strength
Total capital in the companies was booked at NOK 607 billion1 at the end of 2004. Of this capital, 16.1 per cent1 was bound in current assets (mainly receivables) and 83.8 per cent1 in fixed assets (mainly property, plant and equipment). There has been an increase in fixed assets from NOK 473 billion in 2003 to NOK 509 billion1 in 2003. 32 per cent of the capital was financed by short-term debt. Long-term financing by long-term debt made up 42 per cent1 and long-term financing by equity capital 24.8 per cent at the end of 2004. Due to the increase in short-term debt, and just a slight increase in current assets, the current ratio decreased from 0.59 to 0.511 in the course of the year, and thereby decreasing the oil companies' financial strength in 2004.
| Year | Number of enterprises | Operating income Mill. NOK | Operating profit in per cent of operating income | Profit before extraordinary items in per cent of operating income. | Return on total assets. Per cent | Return on equity. Per cent | Equity ratio. Per cent | Current ratio | |||||||||||||||||||||||||||||||
|---|---|---|---|---|---|---|---|---|---|---|---|---|---|---|---|---|---|---|---|---|---|---|---|---|---|---|---|---|---|---|---|---|---|---|---|---|---|---|---|
| 1987 ..... | 50 | 102 054 | 20.4 | 17.9 | 15.8 | 28.5 | 24.1 | 0.88 | |||||||||||||||||||||||||||||||
| 1988 ..... | 52 | 96 902 | 18.8 | 14.8 | 13.1 | 23.0 | 25.1 | 0.92 | |||||||||||||||||||||||||||||||
| 1989 ..... | 54 | 117 800 | 23.4 | 19.3 | 17.6 | 27.9 | 28.1 | 1.00 | |||||||||||||||||||||||||||||||
| 1990 ..... | 55 | 130 088 | 33.1 | 29.7 | 24.1 | 31.5 | 28.7 | 0.84 | |||||||||||||||||||||||||||||||
| 1991 ..... | 53 | 138 694 | 26.5 | 25.0 | 19.9 | 28.2 | 30.4 | 0.71 | |||||||||||||||||||||||||||||||
| 1992 ..... | 51 | 137 078 | 25.0 | 19.4 | 14.2 | 9.5 | 24.3 | 0.73 | |||||||||||||||||||||||||||||||
| 1993 ..... | 52 | 145 929 | 24.4 | 18.2 | 13.6 | 12.8 | 23.1 | 0.62 | |||||||||||||||||||||||||||||||
| 1994 ..... | 47 | 153 754 | 23.7 | 24.5 | 17.2 | 24.5 | 25.4 | 0.57 | |||||||||||||||||||||||||||||||
| 1995 ..... | 46 | 158 748 | 25.4 | 24.0 | 16.7 | 23.8 | 25.9 | 0.60 | |||||||||||||||||||||||||||||||
| 1996 ..... | 43 | 187 587 | 32.6 | 30.4 | 22.4 | 28.4 | 27.3 | 0.72 | |||||||||||||||||||||||||||||||
| 1997 ..... | 41 | 188 256 | 34.0 | 28.7 | 19.9 | 20.3 | 28.2 | 0.68 | |||||||||||||||||||||||||||||||
| 1998 ..... | 39 | 148 133 | 22.4 | 18.7 | 10.5 | 16.2 | 26.9 | 0.72 | |||||||||||||||||||||||||||||||
| 19993..... | 36 | 191 226 | 27.1 | 425.8 | 14.4 | 16.6 | 27.0 | 0.80 | |||||||||||||||||||||||||||||||
| 2000 ..... | 31 | 343 657 | 43.0 | 440.7 | 33.6 | 32.2 | 26.0 | 0.68 | |||||||||||||||||||||||||||||||
| 2001 ..... | 34 | 5 375 032 | 37.3 | 437.2 | 32.1 | 34.3 | 22.6 | 0.49 | |||||||||||||||||||||||||||||||
| 2002 ..... | 34 | 382 797 | 32.4 | 437.1 | 29.9 | 36.0 | 25.1 | 0.54 | |||||||||||||||||||||||||||||||
| 2003 ..... | 32 | 403 532 | 33.3 | 435.0 | 27.3 | 37.5 | 27.8 | 0.59 | |||||||||||||||||||||||||||||||
| 20046..... | 37 | 496 706 | 36.0 | 440.5 | 35.1 | 44.1 | 26.0 | 0.51 | |||||||||||||||||||||||||||||||
| 1 | Includes all activities in the enterprises, also not oil related. |
| 2 | Not included the state´s direct financial interest. |
| 3 | New accounting law in force from 1999. |
| 4 | Ordinary profit before taxes. |
| 5 | The figures for operating income are not directly compareable with the previous year. |
| 6 | The figures for 2004 are corrected 30 October 2007. |
| More information: Division for Energy and Industrial Production Statistics. | |
| Key figures1 | All licensees | Of this the state's direct financial interest | |||||||||||||||||||||||||||||||||||||
|---|---|---|---|---|---|---|---|---|---|---|---|---|---|---|---|---|---|---|---|---|---|---|---|---|---|---|---|---|---|---|---|---|---|---|---|---|---|---|---|
| 2003 | 20043 | 20032 | 20042 | ||||||||||||||||||||||||||||||||||||
| 1) Number of enterprises | 33 | 38 | 1 | 1 | |||||||||||||||||||||||||||||||||||
| 2) Employees as of 31 December | 19 756 | 19 502 | - | - | |||||||||||||||||||||||||||||||||||
| NOK million | |||||||||||||||||||||||||||||||||||||||
| 3) Operating income | 508 717 | 621 225 | 105 185 | 124 519 | |||||||||||||||||||||||||||||||||||
| 4) Operating profit | 202 549 | 262 261 | 68 147 | 83 653 | |||||||||||||||||||||||||||||||||||
| 5) Financial items, net | 371 | 14 355 | -6 571 | -7 987 | |||||||||||||||||||||||||||||||||||
| 6) Operating result before taxes | 202 920 | 276 616 | 61 576 | 75 666 | |||||||||||||||||||||||||||||||||||
| 7) Ordinary result | 114 409 | 144 665 | 61 576 | 75 666 | |||||||||||||||||||||||||||||||||||
| 8) Annual profit | 107 245 | 143 729 | 61 576 | 75 666 | |||||||||||||||||||||||||||||||||||
| 9) Fixed assets | 597 820 | 640 715 | 124 407 | 131 878 | |||||||||||||||||||||||||||||||||||
| 10) Current assets | 94 436 | 109 996 | 11 101 | 12 151 | |||||||||||||||||||||||||||||||||||
| 11) Long-term liabilities | 270 781 | 272 172 | 11 140 | 15 931 | |||||||||||||||||||||||||||||||||||
| 12) Short-term liabilities | 148 220 | 200 530 | 5 986 | 7 568 | |||||||||||||||||||||||||||||||||||
| 13) Equity | 273 256 | 278 009 | 118 382 | 120 530 | |||||||||||||||||||||||||||||||||||
| 14) Total liabilities and equity | 692 257 | 750 711 | 135 508 | 144 029 | |||||||||||||||||||||||||||||||||||
| Per cent | |||||||||||||||||||||||||||||||||||||||
| 15) Return on total assets | 31.9 | 39.6 | . | . | |||||||||||||||||||||||||||||||||||
| 16) Return on equity | 44.0 | 52.3 | . | . | |||||||||||||||||||||||||||||||||||
| 17) Equity ratio | 39.5 | 37.0 | . | . | |||||||||||||||||||||||||||||||||||
| 18) Current ratio | 0.64 | 0.55 | . | . | |||||||||||||||||||||||||||||||||||
| 1 | Key figures per 31 December. |
| 2 | The figures for Petoro are included in the figures for all licenses and not in the figures for the State´s direct financial interest. |
| 3 | The figures for 2004 are corrected 30 October 2007. |
| More information: Division Energy and Industrial Production Statistics. | |
1Corrected 30.10.2007.
The statistics is published with Accounting statistics for non-financial limited companies.
Contact
-
Statistics Norway's Information Centre
E-mail: informasjon@ssb.no
tel.: (+47) 21 09 46 42