Content
Published:
This is an archived release.
Electricity most important energy source in households
The energy consumption per household was on average nearly 22 700 kWh in 2001. Electricity was the most important energy source in households, and the average consumption was approximately 18 000 kWh. This accounts for 79 per cent of the households' total energy consumption. Fuel wood accounts for 15 per cent of the energy consumption, while oil and kerosene together makes up 5 per cent.
The results are based on a sample survey with information from 1 000 households.
Significant differences in energy consumption between different house types
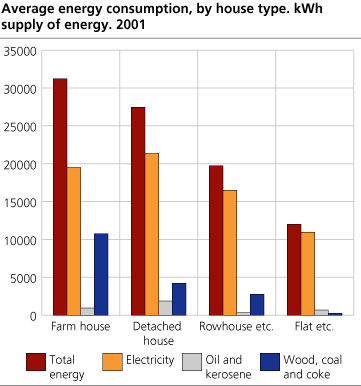
Large differences exicist in energy consumption between different house types and household types. While the energy consumption was 27 450 kWh in a detached house in 2001, the consumption was 12 000 kWh in a flat. This is, among other things, due to larger dwelling area and the household size in a detached house than in a flat, and that a detached house has many outer walls, while a flat receives heat from the surrounding apartments. The specific energy consumption (energy consumption per m2), was 214 kWh / m2 in detached houses in 2001, and 174 kWh/m2 in flats.
The average consumption in row houses etc. was 19 700 kWh in 2001, while the specific consumption was 193 kWh/m2. The average dwelling area and the household size in such houses are larger than the average in flats, but smaller than in detached houses. As in flats, they receive heat from surrounding apartments and can therefore save some energy for space heating.
Households in farmhouses have the highest energy consumption, with approximately 31 200 kWh in 2001. Consumption of wood is high in farmhouses and made up 34 per cent of the energy consumption in such houses. Wood has a low thermal efficiency coefficient, 65 per cent, while it is 100 per cent for electricity. By calculating the energy consumption to utilized energy, the difference between farmhouses and detached houses becomes smaller, see table 5. The difference that still is left might be due to the fact that many farmhouses are old and probably poorly insulated. In addition, some of the electricity used for farming purposes might have been included.
Dwelling area important for the energy consumption
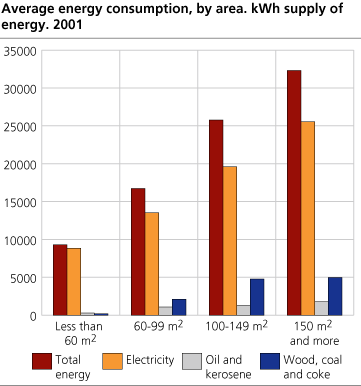
Energy consumption depends to a large degree on the dwelling area. While the energy consumption in houses less than 60 m2 is 9300 kWh per year, on average 32 300 kWh of energy are used in houses more than 150 m2. Table 4 shows that houses with dwelling area less than 60 m2 and more than 150 m2, have the lowest specific energy consumption, 198 and 171 kWh /m2 respectively. An explanation is that most of the houses less than 60 m2 are flats that receive heat from surrounding apartments. Houses more than 150 m2 are often detached houses, but specific energy consumption is still low because of “large scale benefits”. Energy needs for electrical appliances such as refrigerator, freezer and cooker are not dependent of the dwelling area. In addition, it is likely that a smaller part of the dwelling area is heated in large houses than in smaller houses.
Several heating opportunities in detached houses
Detached houses and farmhouses have several heating opportunities than other house types, see table 9. 49 per cent of all flats had only electrical space heaters/ or. floor heating, while 22 per cent only had common central heating in 2001. Among farmhouses, only 4.7 per cent have only electric space heaters/electric floor heaters, while this is the case for 7.5 per cent of all detached houses. For detached houses and row houses etc., the most common combination of heating equipment is electric space heaters/electric floor heating and stove for solid fuels/open fireplace. 61 per cent of all detached houses /farmhouses and 57 per cent of all row houses etc. have this combination of heating equipment. The electricity portion of the energy consumption is largest in flats, with 91 per cent. In detached houses, this portion makes up 78 per cent of the energy consumption. Households in detached houses still have the largest electricity consumption, on average 21 350 kWh in 2001. This is almost twice as much as the electricity consumption in a flat.
Energy consumption by household size and income
The energy consumption in households with only one person is half as large as the energy consumption in households with more than 4 persons. On average, a household with one person used approximately 15 700 kWh in 2001, while households with more than 4 persons used 31 400 kWh. An explanation for this is that large households have more dwelling area than small households, and that many of these households live in detached houses, while small households often live in flats. Energy consumption for shower baths, laundry etc. increases with the household size, and several household members will therefore result in higher energy consumption. Table 3 shows that specific energy consumption increases with the household size up to three persons, and decreases after that. The decrease is due to households with more than three persons having the largest dwelling area, and consequently "large scale benefits" as mentioned earlier.
Differences in energy consumption due to the year of construction
Table 4 shows that specific energy consumption is lower in new houses than in old houses. While the specific consumption is more than 200 kWh/m2 in a house constructed before 1980, the specific energy consumption was 185 kWh/m2 in a house constructed after 1990. This is among other things, due to better insulation in newer houses, but can also be due to differences in dwelling area and distribution on house types in different periods. Between 1980 and 1990, relatively many detached houses and few flats were constructed, and the average energy consumption is thus relatively high in this period (see table 2). However, detached houses constructed after 1980 are larger than older houses, and have consequently “large scale benefits”, that reduce the energy consumption per m2.
The consumption of oil and kerosene in new dwellings is significantly lower than in old houses. While the oil and kerosene consumption in a dwelling constructed after 1990 is only 119 kWh on average, this consumption accounts for 2 509 kWh in a house constructed in the period 1931-1954. An explanation might be that relatively few houses are constructed with stove for oil and/or kerosene after 1980, according to the Housing and Population Census for 2001.
Energy economizing efforts in dwellings
In recent years, energy economizing has become popular in Norway. In addition, electricity prices for households have been rising, and rose from 42.2 øre/kWh in 2000 to 49 øre/kWh in 2001(incl. grid rent and electricity use tax, excl. VAT). This might have motivated the households to save energy. 85 per cent of the households in this survey have answered that they have carried out efforts to save energy, for instance using water saving shower heads, lowered the temperature at night, put in additional insulation in the dwelling etc. The portion that has carried out saving efforts is higher for households living in detached houses, farmhouses and row houses than in flats.
Development in households energy consumption
The results of this survey are not comparable with the results from the last survey on energy consumption in households that was accomplished for the years 1993-1995. This is partly due to different methods for correcting sample biases.
An alternative way to study the development in households energy consumption is to combine figures for energy consumption in households from the annual Energy Balance for Norway with the number of households. This can be seen in figure 3, where figures for the number of households are taken from the Population and Housing Census for 1990 and 2001, and are extrapolated for the other years. The figure indicates that the energy consumption per household was on about the same level in 2001 as in 1990. It has been some annual variations that can be attributed to temperature variations. The figures show that the consumption per household increased in 1996, which was a relatively cold year, and was less in the warm year 2000. The figure also shows that oil and kerosene consumption per household has been less from 1990 to 2001. This may be due to differences in heating equipment in dwellings as mentioned above. The electricity consumption has been around 18 000 kWh per households in this period, with some annual variations. The energy consumption in this figure includes consumption in holiday homes/cottages, while this is excluded in the results for 2001 presented in this article.
Tables:
- Table 1 Average energy consumption, by housetype, household size and net income. kWh supply of energy per household. 2001
- Table 2 Average energy consumption by year of construction, region and dwelling area. kWh supply of energy per household. 2001
- Table 3 Average specific energy consumption, by house type, household size and net income. 2001. kWh supply of energy per m2 per household
- Table 4 Average annual specific energy consumption, by year of construction, region and area. 2001. kWh supply of energy per m2 per household
- Table 5 Average energy consumption by house type, year of construction and region. kWh utilized energy per household. 2001
- Table 6 Households by heating equipment combinations. 2001. Per cent
- Table 7 Heating equipment in dwellings. 2001. Per cent
- Table 8 Households by heating equipment combinations. 2001. Per cent
- Table 9 Households by main heating source. 2001. Per cent
Contact
-
Ann Christin Bøeng
E-mail: ann.christin.boeng@ssb.no
tel.: (+47) 40 81 13 58


