Content
Published:
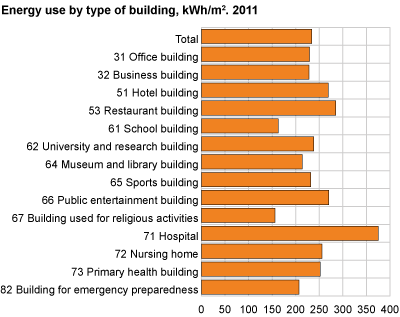
Large differences in energy use between types of building
In 2011, average purchased energy use in industrial buildings within service industries was 234 kWh/m 2 . This is about the same compared to the same type of buildings in 2008. The energy use in hospitals was among the highest, at 375 kWh/m 2 in 2011.
The statistics show large variations in energy use per square metrebetween and within different building types. This can be explained by differences in building constructions, area of application, the amount of electrical equipment and the scope of implemented energy efficiency measures. Buildings with a high energy use had extremely energy-intensive equipment, while those with a very low energy use had limited technical equipment and a short period of use.
Schoolhouses and kindergartens are among the building types with the lowest energy use per square metre. Primary schools and upper secondary schools used on average 150 kWh/m2.
Relatively warm weather in 2011
The temperature is an important variable in explaining energy use. The figures published here are not temperature adjusted but they will be in 2013 when the final figures for 2011 are published. In 2011, the average temperature for Norway was 1.8 degrees Celsius above the normal temperature for the period 1961–1990. In 2008, it was 1.4 degrees Celsius above the normal.
Electricity and district heating the largest energy sources
The largest energy source in most building types is electricity (on average 77 per cent), but for some buildings district heating accounts for a substantial share of total energy use. The building types that use a high share of district heating include universities, colleges and sports centres. The share of district heating accounted for 18 per cent of total energy use in buildings. Heating oil is also used in some buildings, but accounted for just 2.1 per cent of total energy use. Other energy sources, such as pellets and gas were important energy sources for some large buildings. However, in total, these energy sources accounted for only a minor share of total energy use. Results also show that the use of wood is not common in industrial buildings.
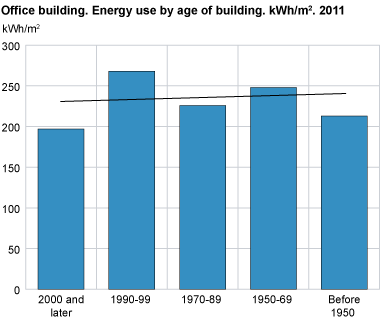
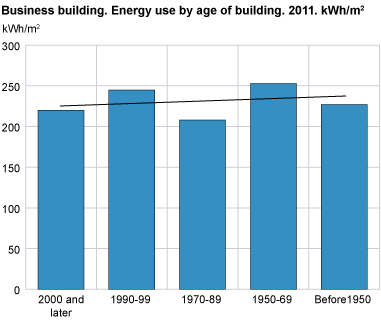
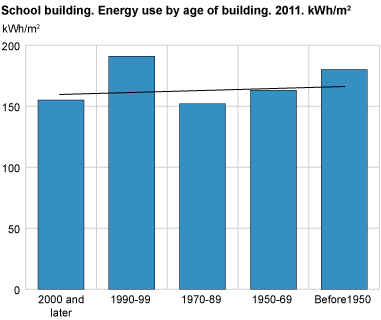
Slightly lower energy use in newer buildings
There is no strong relationship between a building’s age and energy use, but some of the building types best represented in the survey have a slightly lower energy use in newer buildings. Increased demands for better comfort and indoor climate can partly explain why the energy use in newer buildings is not lower.
Central heating an important heating source
About 70 per cent of the buildings in the sample had central heating as their main heating source. Buildings with central heating had a higher energy use in most building types than those without central heating.
Heat recovery ventilation system most common
Ninety per cent of the buildings had balanced mechanical ventilation with heat recovery as the main source of ventilation. Three per cent had balanced mechanical ventilation without heat recovery, and four per cent had a mechanical exhaust ventilation system. Three per cent had natural ventilation as the main source of ventilation.
Tables
Contact
-
Statistics Norway's Information Centre
E-mail: informasjon@ssb.no
tel.: (+47) 21 09 46 42