Content
Published:
This is an archived release.
Higher electricity consumption in 2004
After a drop in the electricity consumption in 2003 due to a significant increase in the power prices, the consumption rose again in 2004 - by 6.5 per cent to 110 TWh. This is roughly at the same level as in the five years ahead of 2003. The total energy consumption rose by scarcely 4 per cent.
The results are based on preliminary figures for 2004 and final figures for 2003.
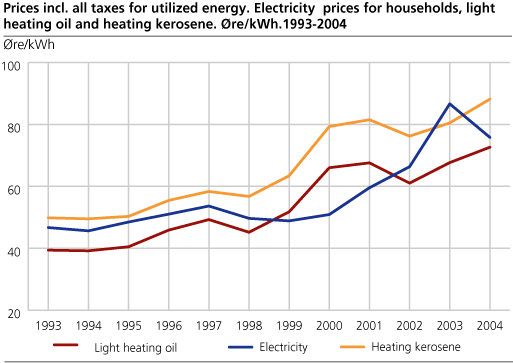
In 2003 electricity was partly replaced by oil because of record high power prices this year. This development reversed in 2004 due to reduced electricity prices while the prices of heating oils rose. The total electricity price to households, who pay most among different user groups, fell from 87 øre/kWh in 2003 to approximately 76 øre/kWh in 2004. The list prices of kerosene and light heating oil were 88 and 76 Øre/kWh in 2004, up 10 and 7 per cent respectively from the previous year. In addition to increased electricity consumption, the consumption of district heating, natural gas and coal rose considerably from 2003 to 2004, by 9, 17 and 11 per cent respectively.
Economic growth an important reason
High economic growth has probably contributed to the rise in energy consumption, because higher production and economic activity entail higher demand for energy. According to preliminary figures from the National accounts, the GDP rose by 3.5 per cent from 2003 to 2004. This is the highest growth since 1998. In addition, more transport activity contributed to more energy consumption in airplanes and other means of transport. Among other circumstances, it was a boom in inland aircraft traffic, after a decline in 2001-2003. The average temperature was almost the same in 2003 and 2004. It was somewhat warmer than normal in both years according to the Norwegian Meteorological Institute.
Households
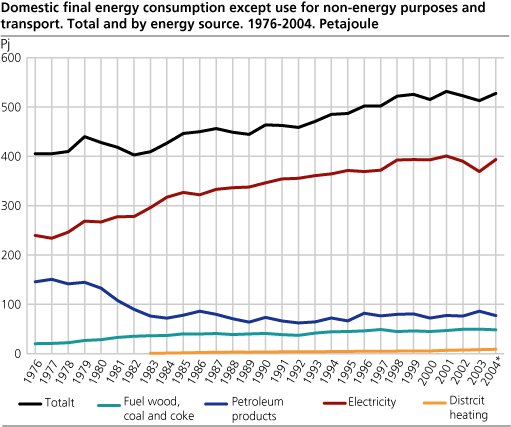
In households, the total energy consumption in dwellings rose by scarcely 2 per cent from 2003 to 2004, to 162 Petajoule, corresponding to 45 TWh. This is below the level in the period 1998-2002 (except 2000), and implies that the average stationary consumption per household was lower in 2003 and 2004 compared to these years. Electricity is the most important energy consumption in households, and made up 74 per cent of the households` energy consumption in 2004. In 2003 the households' electricity consumption were considerably reduced from the previous year, partly due to electricity saving efforts and partly due to that electricity was replaced by other energy sources. In 2004, this development turned, and the use of heating oils and kerosene fell. The consumption of district heating in households rose by 11 per cent from the previous year, but constitutes still only 1 per cent of the households' total energy consumption.
The figure for consumption of fuel wood in households is not yet available for 2004, and we have used the consumption figure for 2003 as an estimate. This figure was 28 Petajoule, or about 33 80-litres fuel wood sacks per household on average. The statistics doesn’t show any increase in the consumption of fuel wood in 2003, in spite of the rise in electricity prices this year. This might be due to the fact that the figures for fuel wood in households is based on information about acquires, not consumption. If the households used much fuel wood from stocks in 2003, the real consumption might be higher than the figure that appears from the statistics.
Increased consumption of auto diesel
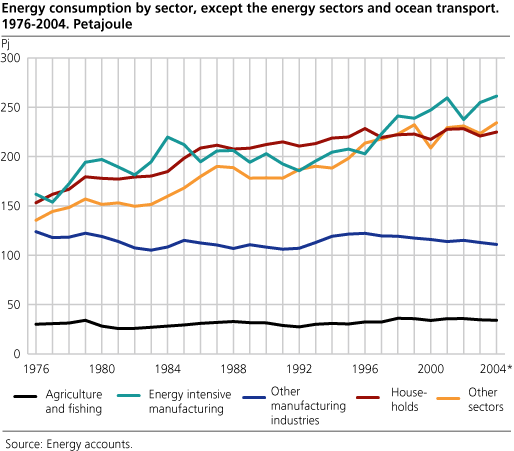
Cars with diesel motor make up an increasingly proportion of the sale of new cars, and table 12 tells us that consumption of auto diesel in households more than doubled from 1996 to 2004, while the consumption of gasoline was somewhat reduced. However, gasoline still makes up about 88 per cent of the total consumption of fuels in private cars. Within industry and transport sectors, we can see a similar development, with constant or reduced gasoline consumption and increased consumption of diesel. From 2003 to 2004, the total gasoline consumption was reduced by 0.5 per cent while total consumption of auto diesel rose by 9 per cent. The total energy consumption in the transport sector rose by 5 per cent from 2003 to 2004, and the increase was highest within aircraft - and road transport.
Higher energy consumption in metal production
In total manufacturing industries the energy consumption rose by 4 per cent from 2003 to 2004. This is especially due to that metal-producing industries used 11 per cent more energy in 2004 than in the previous year, probably due to higher production. Energy consumption in these industries makes up about 45 per cent of the total energy consumption in manufacturing industries. For manufacturing industries except from energy intensive industries and manufacturing of paper and paper products, the energy consumption fell by 4 per cent from the previous year. The electricity consumption in total manufacturing industries rose by 7 per cent, while the use of oil products and LPG was reduced with 13 per cent. Consumption of coal and coke that mainly are used for non-energy purposes rose by 11 and 5 per cent respectively.
Services
Within commodity trade and private and public services, the energy consumption for stationary purposes rose by 5 per cent from 2003 to 2004. This can be attributed to higher economic activity in 2004. Also in services, heating oils was in some degree replaced with electricity in 2004 compared with 2003.
High imports of electricity in 2004
The production of electricity increased by 3 per cent from 2003 to 2004, up to 110.6 TWh in 2004 that is about 7 TWh below the production that one can expect when the precipitation is normal. The water reservoir level was still below normal in 2004, and the electricity imports were therefore high. About 14 per cent of the electricity consumption this year was based on imports, and one fourth of this came from coal power in Denmark. However, in 2005, the electricity production has increased considerably compared with the previous year, and in the period January-August, the production was 25 per cent higher than in the same period in 2004. Power exports also exceeded imports, and we had an export surplus) on 7.3 TWh in this period. See monthly electricity statistics http://www.ssb.no/english/subjects/10/08/10/elektrisitet_en/
Nearly half of the energy consumption based on renewable energy sources
More than 99 per cent of the electricity production in Norway is produced from renewable energy sources, as hydro- wind power and electricity production from biomass. By assuming that 85-90 per cent of the electricity consumption in 2004 came from renewable energy, almost 50 per cent of the total net domestic energy consumption was based on renewable energy sources. This proportion is somewhat uncertain because we don’t know what all the power imports are produced of. Renewable energy also includes use of biomass and district heating that are produced from waste and biomass. It is an aim for Norwegian energy policy that an increasingly part of the energy consumption shall be based on renewable energy sources.
According to international energy statistics (International Energy Agency), renewable energy made up 6 per cent of the total primary energy supply for OECD total in 2004, but 40 per cent for Norway (45 per cent in 2003). Total primary energy supply is defined as total primary energy production + imports, exports, marine bunkers and stock changes.
About the figures
This article is based on results from the energy balance / energy sources balance sheet. These tables are based on international recommendations. In the table appendix, there are also tables for the energy accounts that follow principles and definitions in the National accounts. See “About the statistics” for more information.
Tables:
- Table 1 Energy sources balance sheet for Norway. 2004
- Table 2 Energy balance sheet for Norway. 2004. Petajoule
- Table 3 Energy accounts. Extraction, conversion and use of energy goods. 2004. Preliminary figures
- Table 4 Energy accounts. Use of energy goods outside the energy sectors, by industry. 2004. Preliminary figures
- Table 5 Energy accounts. Extraction, conversion and use of energy goods. 2004. Preliminary figures. PJ
- Table 6 Energy sources balance sheet for Norway. 2003
- Table 7 Energy balance sheet for Norway. 2003. Petajoule
- Table 8 Energy accounts. Extraction, conversion and use of energy goods. 2003
- Table 9 Energy accounts. Use of energy goods outside the energy sectors, by industry. 2003
- Table 10 Energy accounts. Extraction, conversion and use of energy goods. 2003. PJ
- Table 11 Net consumption of individual energy bearers. 1976-2004
- Table 12 Energi balance sheet. 1993-2004. Petajoule
- Table 13 Percentage share of energy consumption, by individual energy bearers. 1983-2004
- Table 14 Energy consumption in householde. 1990-2004
- Table 15 Energy consumption in householde. 1990-2004. Tera Joule
- Table 16 Average list prices of selected petroleum products. Excluding and including taxes. 1992-2004. øre/litre
- Table 17 Calculated prices of utilized energy. 1978-2004. Fixed 1998-prices. øre/kWh. All taxes included
The statistics is now published as Production and consumption of energy, energy balance and energy account.
Additional information
The statistics are published in spring and autumn. The spring publication is preliminary and aggregated to a larger degree, and only includes figures for energy balance. In the autumn publication, tables are also presented for the energy accounts.
Contact
-
Statistics Norway's Information Centre
E-mail: informasjon@ssb.no
tel.: (+47) 21 09 46 42