Content
Published:
This is an archived release.
Large decrease in electricity consumption
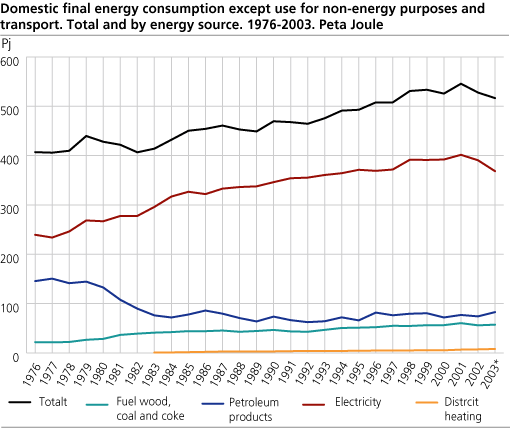
Electricity consumption in Norway fell by about 6 per cent from 2002 to 2003. The decrease was especially large in the households and in the service industries. This development can be attributed to the high rise in electricity prices during the winter 2002/2003 and higher temperatures than in the previous year. The total energy consumption was on about the same level as in the previous year.
In 2003, total electricity consumption was 103 TWh, the lowest level since 1994. This is due to a high increase in electricity prices during the winter 2002/2003. The price rise was a result of low precipitation in the autumn of 2002, and low water reservoir levels. The price rise in electricity made use of other energy sources more profitable. The total consumption of petroleum products and gas rose by 4 per cent, while consumption of fuel wood rose by 3 per cent, according to preliminary figures. In the period 2000-2002, electricity made up 50 per cent of total energy consumption. This figure fell to 47 per cent in 2003.
By looking at the development in energy consumption in the last decade, it looks seems evident that the growth in consumption has leveled out or declined slightly. Domestic energy consumption reached a peak in 1999, with 818 petajoule, while the consumption in 2003 was 782 petajoule, or 4 per cent less than in 1999. From 1993 to 1999, energy consumption rose by 14 per cent in total. (See table 14).
Drop in household electricity consumption
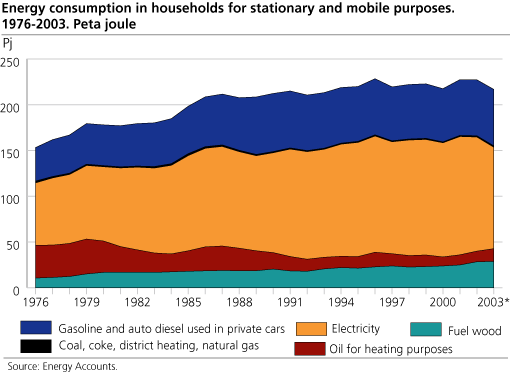
According to preliminary figures for 2003, household electricity consumption fell by 11 per cent from 2002 to 2003. The total electricity price to households, including all taxes, was about 90 øre/kWh, 35 per cent higher than in 2002. The high electricity price has probably implied electricity saving efforts in the households. Higher temperatures than normal can also explain the drop in electricity consumption.
Consumption of kerosene, heating oils and district heating in households rose by 15, 27 and 12 per cent respectively from 2002 to 2003. Consumption of fuel wood has probably also increased from 2002 to 2003 because of the high electricity prices, but the figure for fuel wood is not available yet and is therefore uncertain.
Energy consumption in trade and industry
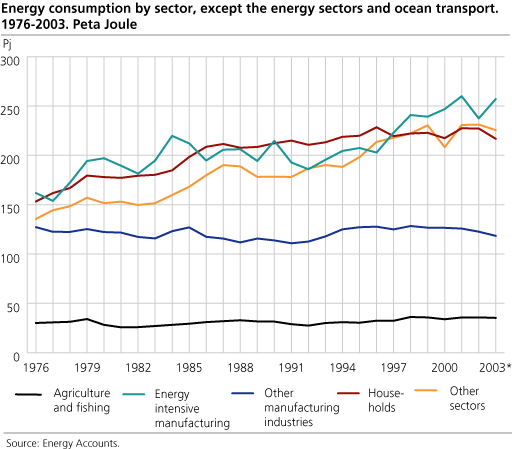
Energy consumption in the manufacturing industry rose by about 2 per cent from 2002 to 2003, mainly because of higher consumption in energy intensive industries. Energy consumption in the service industry fell by 8 per cent, mainly because of lower electricity consumption, while energy consumption for transport purposes rose by 2 per cent.
Table 19 shows the total energy consumption, and energy consumption by households in different countries. Compared with other European countries, Norway has a high level of total energy consumption per inhabitant. This is, among other things, due to the fact that Norway has many energy intensive industries. Total energy consumption in households per inhabitant is on about the same level as in other northern countries, at about 10 MWh. However, electricity represents a higher share of total energy consumption in Norway than in other countries, partly because electricity is more commonly used as a heating source.
Tables:
- Table 1 Energy sources balance sheet for Norway. 2003
- Table 2 Energy balance sheet for Norway. 2003. Petajoule
- Table 3 Energy accounts. Extraction, conversion and use of energy goods. 2003. Preliminary figures
- Table 4 Energy accounts. Use of energy goods outside the energy sectors, by industry. 2003. Preliminary figures
- Table 5 Energy accounts. Extraction, conversion and use of energy goods. 2003. Preliminary figures. PJ
- Table 6 Energy sources balance sheet for Norway. 2002
- Table 7 Energy balance sheet for Norway. 2002. Petajoule
- Table 8 Energy accounts. Extraction, conversion and use of energy goods. 2002
- Table 9 Energy accounts. Use of energy goods outside the energy sectors, by industry. 2002
- Table 10 Energy accounts. Extraction, conversion and use of energy goods. 2002. PJ
- Table 11 Net consumption of individual energy bearers. 1976-2003. Revised figures (21 February 2005)
- Table 12 Energi balance sheet. 1993-2003. Petajoule. Revised figures (21 February 2005)
- Table 13 Percentage share of energy consumption, by individual energy bearers. 1983-2003. Revised figures (21 February 2005)
- Table 14 Energy consumption in householde. 1990-2003. Revised figures (21 February 2005)
- Table 15 Energy consumption in householde. 1990-2003. Tera Joule. Revised figures (21 February 2005)
- Table 16 Average list prices of selected petroleum products. Excluding and including taxes. 1992-2003
- Table 17 Calculated prices of utilized energy. 1978-2003. Fixed 1998-prices. øre/kWh. All taxes included
- Table 18 Number of degree-days. 1970-2003
- Table 19 Final consumption of energy and energy consumption per inhabitant in different countries. 2002. Terajoules and kWh
The statistics is now published as Production and consumption of energy, energy balance and energy account.
Additional information
The statistics are published in spring and autumn. The spring publication is preliminary and aggregated to a larger degree, and only includes figures for energy balance. In the autumn publication, tables are also presented for the energy accounts.
Contact
-
Statistics Norway's Information Centre
E-mail: informasjon@ssb.no
tel.: (+47) 21 09 46 42


