Content
Published:
This is an archived release.
Lower energy consumption
The energy consumption fell by 4.5 per cent1 from 2010 to 2011. This is due to record warm weather in 2011, while the previous year was cold.
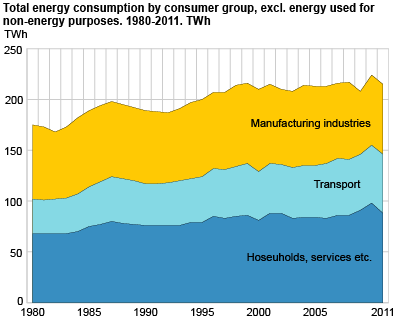
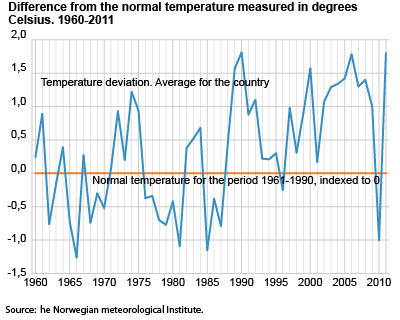
2011 was one of the warmest years on record in Norway, with a temperature of 1.8 degrees Celsius above the average temperature for the period 1961-1990. This implied a particularly large decrease in the consumption of petroleum products and electricity in the group “other sectors”, which mainly consists of households and service industries, in addition to construction and fishing and agriculture. The consumption in this group dropped by 10 per cent from the previous year. The large decrease from the previous year must be seen in connection with the fact that 2010 was unusually cold, which resulted in a record high energy consumption this year.
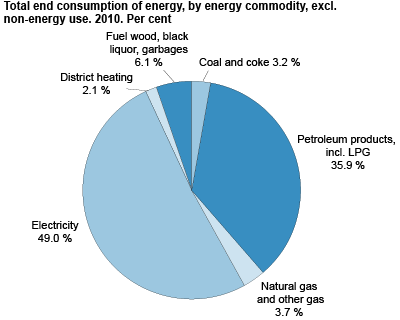
About 70 per cent of the energy consumption in the group ”other sectors” is electricity, and this consumption fell by 11 per cent from 2010 to 2011. There was also a significant decrease in the use of heating oils and kerosene. In total, the use of petroleum products in this group fell by 13 per cent from the previous year. Increased prices of oil products may also have contributed to the drop in this consumption.
The GDP for mainland Norway rose by 2.6 per cent from 2010 to 2011, and there was a particularly positive development for the service sector. Economic growth usually contributes to a higher energy consumption, but high temperatures have more than offset this factor for the service sector.

Small decline in energy consumption for manufacturing industries2
The total energy consumption in manufacturing industries in 2011 fell by about 1 per cent from 2010, according to preliminary figures. Consumption of oil products, including LPG, fell by about 7 per cent, while consumption of electricity was reduced by about 2 per cent. Consumption of coal and gases rose somewhat from 2010.
Small change in energy consumption for transport purposes2
Consumption of gasoline has had a declining trend in recent years, and continued to fall in 2011 by about 9 per cent from 2010. However, there was an increase in the consumption of diesel, marine gas oils and natural gas, so the total consumption in transport rose by about 0.3 per cent from the previous year.
Lower energy production
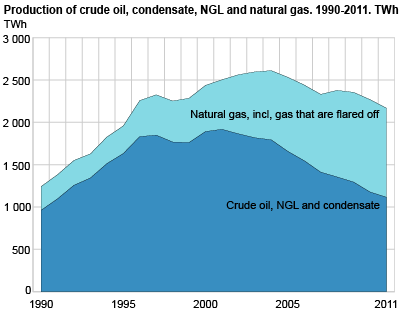
The total energy production dropped from 2010 to 2011. Production of crude oil, condensate and NGL in total fell by about 5 per cent, while production of natural gas fell by 4 per cent from 2010. Electricity production increased by 3 per cent from 2010 to 2011, but because 90 per cent of the total energy production consists of oil and gas, this did not offset the decrease in other energy consumption. The export of oil and natural gas is an important source of income for Norway. In 2011, the total energy export dropped by 6 per cent due to lower petroleum production.
Reduction in Norway renewable energy share
At the end of 2011, Norway decided to implement the EU’s renewable energy directive, which entails a target of 67.5 per cent for Norway’s renewable energy consumption in 2020. This is about 7.5 per cent more than the renewable share in 2005. The way the renewable share is calculated means that it is affected by changes in the total energy consumption. The renewable energy share rose considerably in 2009, and came to 65 per cent due to a reduction in energy consumption caused by the financial crisis in this year. In 2010 however, the renewable share dropped to 61 per cent due to the record high energy consumption in this year. The renewable energy share is calculated using data from the energy balance, but these data are still not detailed enough to calculate an updated share for 2011.However, the reduction in energy consumption this year indicates that the share will also increase somewhat in 2011.
Norway has a rather high renewable energy share compared to other countries. This is mainly due to the fact that our production and use of hydro power is extensive. The main obstacle to increasing the renewable share further is that energy used for transport purposes is mainly based on fossil fuels. The transport consumption has made up an increasing share of our energy consumption, and now constitutes about one quarter of our total energy consumption.
| 1Figure corrected 4 May 2012 |
| 2Section corrected 4 May 2012 |
Tables:
- Table 1 Energy sources balance sheet for Norway. 2011
- Table 2 Energy sources balance sheet for Norway. 2010
- Table 3 Energy balance sheet for Norway. 2011. Petajoule
- Table 4 Energy balance sheet for Norway. 2010. Petajoule
- Table 5 Net consumption of individual energy products. 1976-2011
- Table 6 Energy balance, total energy 2000-2011. GWh
- Table 7 Supply and use of electricity 2000-2011. GWh
- Table 8 Calculation of the overall renewable energy share for Norway, 2004-2010. GWh og prosent
The statistics is now published as Production and consumption of energy, energy balance and energy account.
Additional information
The statistics are published in spring and autumn. The spring publication is preliminary and aggregated to a larger degree, and only includes figures for energy balance. In the autumn publication, tables are also presented for the energy accounts.
Contact
-
Statistics Norway's Information Centre
E-mail: informasjon@ssb.no
tel.: (+47) 21 09 46 42