Content
Published:
This is an archived release.
Record high energy consumption in 2010
The energy consumption in Norway 2010 rose by about 7 per cent from the previous year, and is the highest consumption ever. The increase is due to economic growth and a cold winter.
After a drop in the energy consumption in 2009 due to lower economic activity induced by the financial crisis, the energy consumption rose again in 2010. This could be attributed to recovery of the economy and low temperatures. Energy consumption is related to economic growth, and in 2010, the gross domestic product rose by more than 2 per cent for mainland Norway after a drop of 1.3 per cent in 2009. Some parts of the manufacturing industry in particular experienced a slump in 2009, with the subsequent upturn in 2010.
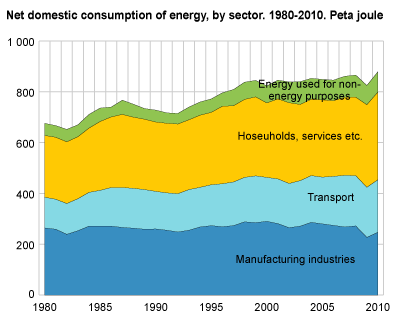
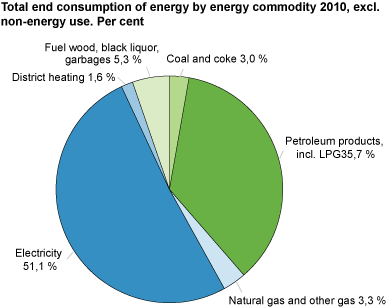
The total domestic energy consumption reached 879 petajoule in 2010, which corresponds to 244 TWh. This includes energy used for non-energy purposes, but excludes energy used by energy-producing industries such as oil and gas extraction. Of this, electricity and petroleum products made up 46 and 39 per cent respectively. Consumption of electricity rose by 7 per cent from the previous year, while consumption of petroleum products rose by 6 per cent. Consumption of gas, coal and coke also increased.
Economic growth and cold weather contributed to increased consumption
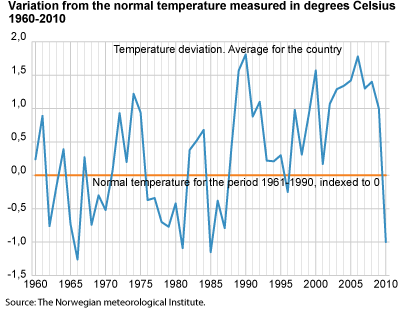
The cold winter in 2010 contributed to an increase in the need for energy for heating purposes. The temperature in 2010 was on average 1 degree Celsius below the normal temperature for the period 1961-1990. This is the lowest temperature we have experienced since 1987. For comparison, the temperature has been above the climatic period for the period 1961-1990 almost every year since 1987.
Energy consumption in the service sector and households is closely related to temperature. In households, about half of the energy consumption is used for heating purposes. In manufacturing industries, the main part of the energy is used in industrial processes, and a high share of the products is exported. Consequently, the energy consumption depends mainly on market conditions and international economic cycles.
Higher energy consumption in manufacturing industries in 2010
In the manufacturing industries, energy used for energy purposes and non-energy use rose by 9 and 5 per cent respectively, according to preliminary figures. The high increase is related to the large drop in the industries’ energy consumption in 2009, and a subsequent increase in 2010. The manufacturing industries’ consumption in 2010 was still somewhat lower than the level in the years prior to the financial crisis. About a quarter of the energy consumption in manufacturing industries is used for non-energy purposes. When non-energy use is included, the industries’ energy consumption makes up about 37 per cent of our total domestic energy consumption. Non-energy use comprises, for instance, natural gas used in the production of methanol, LPG used in plastic products and petroleum coke used in the production of carbon anodes.
Still few electric cars
The energy consumption for transport purposes rose by about 5.5 per cent from the previous year, and came to 207 petajoule (58 TWh) in 2010. About 24 per cent of the domestic energy consumption including non-energy use is used for transport purposes. Most of the energy used in transport is petroleum products, and gives emissions to the air. Several economic incentives have been introduced in order to encourage greater use of electric cars because these are regarded as more environmental friendly. However, the number of electric cars is still low. Figures from the vehicle register show that 2 196 electric cars were registered in 2010, which is 940 more cars than in 2005. The average driving distance per year was 6 806 km. These cars use below 0.2 kWh per km, and calculated electricity consumption for the total stock of electric cars is calculated to be about 2.7 GWh in 2010. Hybrid cars are not included here.
Record high energy consumption in households and services
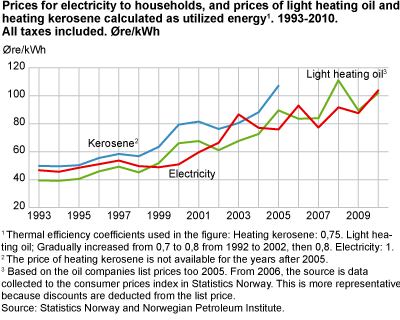
Within so-called "other sectors", which comprise services, households, construction, fishing and agriculture, the energy consumption rose by about 6 per cent from the previous year. Consumption reached 345 Petajoule, which is the highest consumption for this sector ever, despite record high electricity prices in 2010. Households paid on average about NOK 1 per kWh in 2010 (incl. grid rent and taxes). The price of heating oil was about the same level, so it was not particularly beneficial to change to consumption of oil. Consumption of electricity and petroleum products rose by 6 and 9 per cent respectively from the previous year in this sector. The increase can be attributed to the cold winter. For the service industries, better market conditions than in 2009 can also be an explanatory factor.
Lower energy production
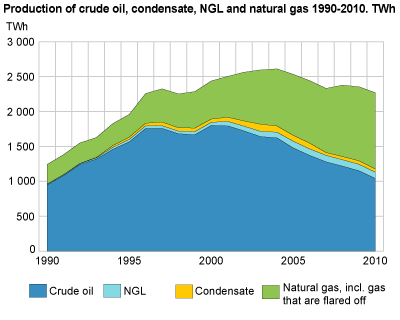
Norway’s total production of primary energy commodities fell by about 4 per cent from the previous year. The total production of crude oil, condensate and NGL declined by 9 per cent in total, while production of natural gas rose by about 3 per cent. Electricity production also fell in 2010 due to less water inflow to the water reservoirs. Lower electricity production and a simultaneous increase in consumption indicates a greater need for electricity imports. In 2010, we had a net import of electricity of 7.5 TWh, while in 2009 there was a net export of 9 TWh.
Traditionally, hydro electricity has made up about 98-99 per cent of our total electricity production, but in 2010, this share was reduced to about 95 per cent. This is due to more electricity being produced from natural gas, especially at the LNG plant on Melkøya, and Naturkraft’s plant on Kårstø. In addition, the energy plant Mongstad started up in 2010. This plant serves the refinery on Mongstad with electricity, and also sells some electricity on the power grid.
Higher renewable energy share in 2009
In 2009, an EU directive stipulating that the renewable energy share of total energy consumption has to increase to 20 per cent in 2020 was adopted. The target is more than double the renewable share in 2005, which was 8.5 per cent on average in the EU countries. All EU countries have individual targets for their increase in the renewable energy share. There is also a transport target which states that the renewable share in transport has to be 10 per cent within 2020 in all the EU countries. The directive is significant to the EEA, and will probably be implemented in Norway. Norway is in negotiations with the EU concerning our target for 2020.
Statistics Norway calculates the renewable energy share for Norway, largely based on data from the energy balance. The calculation is done in a program developed by the EU’s statistics office to calculate this share according to the instructions in the directive. For Norway, the renewable energy share has been between 57 and 62 per cent in 2004-2008, but in 2009 it rose to 65 per cent. The large increase could be related to the financial crisis and the drop in energy consumption. The share for 2010 cannot be calculated based on the preliminary figures, but it is likely that it declined somewhat again in 2010. Norway and Iceland are the countries with the highest renewable energy share when this is calculated according to the method in the EU directive. For more information about the renewable energy share (in Norwegian), see the article “ Konsekvenser for Norge av EUs fornybardirektiv ” in Economic Analyses 4/2010.
Tables:
- Table 1 Energy sources balance sheet for Norway. 2010
- Table 2 Energy sources balance sheet for Norway. 2009
- Table 3 Energy balance sheet for Norway. 2010. Petajoule
- Table 4 Energy balance sheet for Norway. 2009. Petajoule
- Table 5 Net consumption of individual energy commodities. 1976-2010
- Table 6 Energy balance, total energy 1998-2010. GWh
- Table 7 Supply and use of electricity 1998-2010. GWh
- Table 8 Calculation of the overall renewable energy share for Norway, 2004-2009. GWh
The statistics is now published as Production and consumption of energy, energy balance and energy account.
Additional information
The statistics are published in spring and autumn. The spring publication is preliminary and aggregated to a larger degree, and only includes figures for energy balance. In the autumn publication, tables are also presented for the energy accounts.
Contact
-
Statistics Norway's Information Centre
E-mail: informasjon@ssb.no
tel.: (+47) 21 09 46 42

