Content
Published:
This is an archived release.
More consumption of electricity and biodiesel in 2008
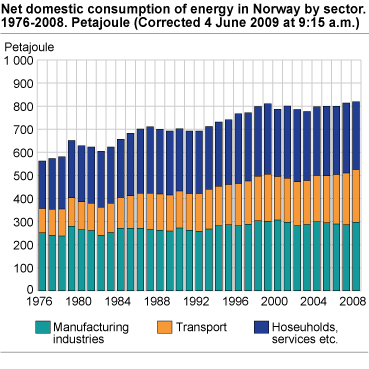
According to preliminary figures, there was an increase in the domestic energy consumption of almost 1 per cent from 2007 to 2008, and more electricity and less oil products were used. Figures related to preliminary energy balance are corrected from what was published 2009.04.24 10:00 am.
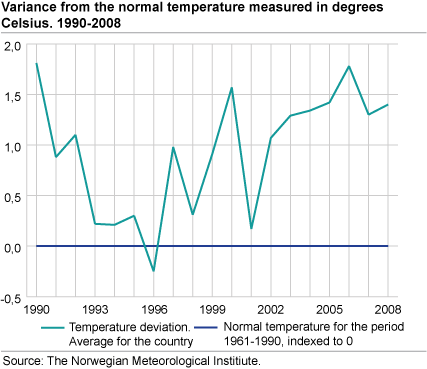
2008 was characterised by a declining economic growth compared to previous years, especially the last quarter in 2008. Nevertheless, the energy consumption followed the past trend with about 1 per cent yearly growth. The average temperature was at about the same level as in 2007. It was 1.4oC warmer than the normal temperature for the period 1961-1990 in 2008, and 1.3oC warmer than normal in 2007.
The manufacturing industries had the highest growth in energy consumption, with a 4 per cent increase from 2007 to 2008, while energy consumption for transport purposes rose by 2 per cent. . In households, the service sector and construction combined, the energy consumption fell by 3 per cent from the previous year. The preliminary figures are somewhat uncertain for the individual sectors because some basic energy statistics are not available yet.
More use of electricity and less oil consumption
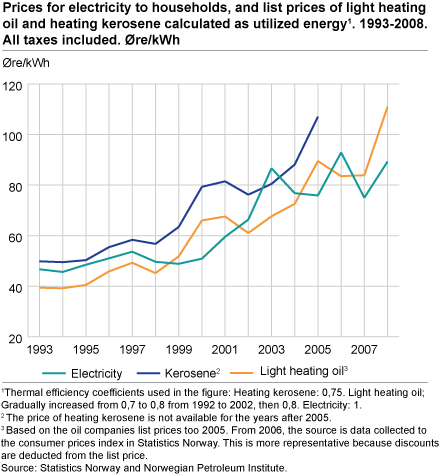
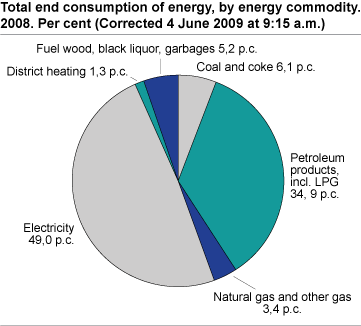
In spite of increased electricity prices in 2008, the total electricity consumption rose by almost 1 per cent from 2007 to 2008, while the total consumption of oil products fell by about 2 per cent. The increase in the electricity consumption can be explained by a relatively higher increase in the oil prices in 2008 than in the electricity prices, in addition to a somewhat higher economic activity level in 2008. In 2008, the electricity prices to households were 89.3 øre/kWh, while the price of heating oil, calculated as utilised energy, reached about 111 øre/kWh on average, thus making electricity the cheapest alternative.
Higher consumption in manufacturing industries
In manufacturing industries, the energy consumption rose by nearly 4 per cent from 2007 to 2008. This can partly be explained by a 3 per cent growth in industry production from the previous year. Consumption of electricity, which accounts for about 60 per cent of the industry’s consumption, rose by about 1 per cent from 2007, while consumption of oil products declined. Furthermore, there was a significant increase in the consumption of petroleum coke of about 50 per cent, mainly due to a new factory that started up at the end of 2007, where petroleum coke is an important raw material.
Higher consumption of biodiesel
The energy consumption for transport purposes was almost unchanged from 2007 to 2008. The consumption of diesel increased, while use of gasoline dropped by about 6 per cent. The sale of biodiesel increased significantly, from 39.2 million litres in 2007 to 103.6 million litres in 2008. This accounted for 4 per cent of the total diesel consumption for transport purposes in 2008. The increase could be due to a resolution from a climate compromise, to introduce trade legislation for biofuels on 2.5 per cent from 2009 and 5 per cent from 2010. Most of the biodiesel that was sold in 2008 (96 per cent) was mixed into normal diesel, while the remainder was sold as pure biodiesel. Some bioethanol was also sold in 2008, but this accounts for a very small share of the total sale of gasoline.
High electricity consumption
The electricity production in 2008 rose by nearly 4 per cent from 2007, and came to almost 143 TWh. This is the second highest electricity production in Norway ever. This contributed to a net export of electricity (exports - imports) of 14 TWh. The Norwegian electricity production is mainly based on hydro power, and the increase in 2008 can be explained by higher water inflow to the water reservoirs. Thermal power and wind power did not account for more than 2 TWh of the total electricity production, or about 1.5 per cent. A higher thermal power production could be expected due to the new gas power plant on Kårstø, but this was not in operation for a large part of 2008, mainly because the price relationship between electricity and gas made it unprofitable.
Less production of crude oil and more natural gas
Since 2001, which was a peak year for Norwegian oil production, the production of oil has been reduced. In 2008, the total production of crude oil, NGL (propane, butane, ethane) and condensate made up 114 million tonnes, which is about 4 per cent lower than in 2007, and 30 per cent lower than in 2001. Nevertheless, the total petroleum production in 2008 rose by about 2 per cent from the previous year. This is due to the fact that the production of natural gas rose by 11 per cent and came to 103 billion Standard cubic metres, including consumption and flare burn-off of natural gas on oil fields and terminals. Natural gas accounts now for about 45 per cent of the total petroleum production on the continental shelf, compared with about 24 per cent in 1990.
More flare burn-off of natural gas
Oil and gas extraction is becoming more and more energy-intensive despite a declining crude oil production. Flare burn-off and consumption of natural gas and electricity consumption to the oil and gas industry accounted for about 67 TWh in 2008, which is about 5 TWh more than what we used in total for transport purposes. Flare burn-off is gas that is burned for safety reasons, and is not used for energy purposes. The flare burn-off has been especially high in recent years, about 11.6 TWh and 10.3 TWh in 2007 and 2008 respectively. This is partly due to more flare burn-off in connection with the start-up of the LNG plant on Melkøya in 2007. The oil installations offshore mainly produce their own electricity based on natural gas, but electricity deliveries from the mainland to the oil and gas industry have increased considerably in recent years. In 2008, this came to more than 3 TWh (see tables 6 and 7).
|
The corrections imply higher use of jet kerosene, marine diesel, heavy fuel oils, heavy distillates and auto diesel for inland consumption and/or bunkering (foreign shipping) compared to previous published figures. This implies that total domestic consumption increase by 0.7 per cent (rounded to 1 per cent in the text) instead of 0.1 per cent from 2007 to 2008. Energy consumption for transport purposes increases by 2 per cent instead of remaining unchanged from 2007, and total consumption of petroleum products declines by 2 per cent instead of 4 per cent. |
Tables:
- Table 1 Energy sources balance sheet for Norway. 2008
- Table 2 Energy sources balance sheet for Norway. 2007
- Table 3 Energy balance sheet for Norway. 2008. Petajoule
- Table 4 Energy balance sheet for Norway. 2007. Petajoule
- Table 5 Net consumption of individual energy bearers. 1976-2008.
- Table 6 Energy balance, total energy 1998-2008. GWh
- Table 7 Supply and use of electricity 1999-2008. GWh
The statistics is now published as Production and consumption of energy, energy balance and energy account.
Additional information
The statistics are published in spring and autumn. The spring publication is preliminary and aggregated to a larger degree, and only includes figures for energy balance. In the autumn publication, tables are also presented for the energy accounts.
Contact
-
Statistics Norway's Information Centre
E-mail: informasjon@ssb.no
tel.: (+47) 21 09 46 42


