Content
Published:
This is an archived release.
Growth in the energy consumption
The total net consumption of energy rose by 3.7 per cent in 2004 compared with the previous year. Reduced electricity prices and higher prices on oil products contributed to higher electricity consumption and lower consumption of heating oils. The total consumption of oil products was on about the same level as in 2003 because of higher oil consumption for transport purposes.
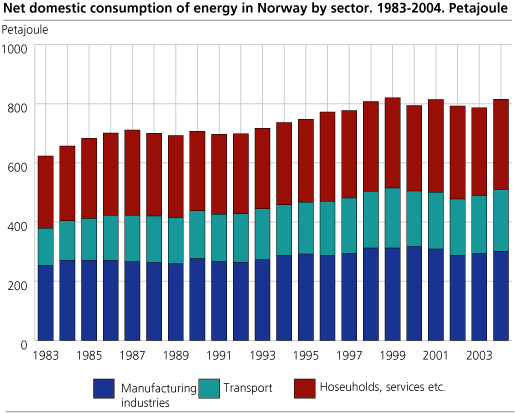
The total end consumption of energy in Norway except from consumption in the energy sectors made up 815 Petajoule. This is on about the same level as on 2001, but above the level in 2002 and 2003. The electricity consumption rose by 6 per cent, corresponding to 6.6 TWh. However, the electricity consumption was unusual low in 2003 due to high electricity prices this year. The consumption of heating oils rose considerably in 2003 but fell to a more normal level in 2004.
The increase in the total energy consumption compared with the previous year is probably related to the economic growth in 2004, particular within the service sectors. The growth in GDP in 2004 is the highest since 1998. There was not any significant difference in the average temperature in 2003 and 2004. As in the seven preceding years, the temperature in 2004 was higher than normal compared with the average for the years 1961-1990, according to the Norwegian Meteorological Institute.
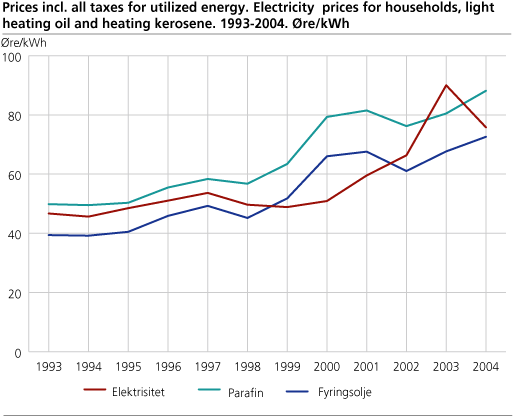
Oil was replaced with electricity
The electricity price for households reached a peak in 2003 with 90 øre/kWh incl. all taxes, but fell in 2004. The prices on heating oil and kerosene rose, and calculated as utilized energy in øre/kWh, the price on heating oil was on about the same level as electricity while kerosene was more expensive. In the manufacturing industries, oil consumption fell by 7 per cent, while electricity consumption rose by 3 per cent. For households, services, farming, fishing and construction gathered, the changes were higher; oil consumption fell with 18 per cent while the electricity consumption rose by 10 per cent. The total energy consumption for manufacturing industries and the other sectors gathered rose by 2 and 3 per cent respectively. The distribution of energy consumption on different sectors is based on preliminary data sources and the changes from the previous year are therefore uncertain.
Higher production
The total production of primary energy sources rose by 1 per cent from 2003 to 2004. The net production of crude oil (except condensate and ngl) fell by 1 per cent from 2003 to 2004, while production of natural gas rose by 7 per cent from the preceding year. The production of electricity was 110 TWh in 2004, that is 3 per cent more than in 2003. This is lower than normal production that is estimated to be 118 TWh when the precipitation is normal. The water trickling was higher than usual in 2004, but the water reservoir level was very low in the beginning of 2004. The electricity companies were therefore covering a high share of the electricity supply with import. The net import of electricity (import - exports) made up 11.4 TWh in 2004 and has never been higher.
Tables:
The statistics is now published as Production and consumption of energy, energy balance and energy account.
Additional information
The statistics are published in spring and autumn. The spring publication is preliminary and aggregated to a larger degree, and only includes figures for energy balance. In the autumn publication, tables are also presented for the energy accounts.
Contact
-
Statistics Norway's Information Centre
E-mail: informasjon@ssb.no
tel.: (+47) 21 09 46 42