Manufacturing statistics. Foreign ownership in manufacturing
Increased foreign ownership in manufacturing
Published:
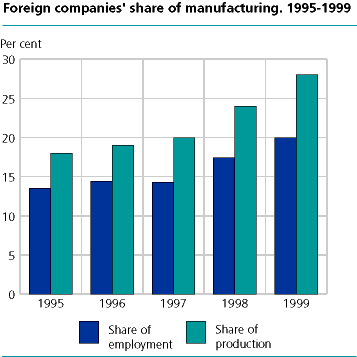
In 1999 every fifth manufacturing worker was employed by foreign-owned company. The number of foreign-owned companies increased throughout the last part of the 1990s – and represented almost 30 per cent of production in manufacturing, mining and quarrying in 1999.
From the middle 1990s the significance of foreign ownership in Norwegian manufacturing, mining and quarrying has increased considerably. The number of employees in foreign-owned companies increased from 38,000 in 1995 to 59,000 in 1999.
The foreign-owned companies produced goods and services for NOK 131 billion in 1999, equivalent to 28 per cent of the total production value in manufacturing, mining and quarrying – compared with 18 per cent in 1995. In the period 1995-1999 the number of foreign ownership increased by somewhat less than 500 to well over 700. The foreign-owned companies were relatively large, and had on average more than 80 employees per company compared with 25 per company for the entire manufacturing industry.
One of three large companies with foreign ownership
The importance of foreign ownership is better seen when focusing on the largest manufacturing companies with 200 or more employees. These manufacturing "locomotives" represented more than 40 per cent of the production measured in value, and more than 30 per cent of employment in 1999.
One third of these large companies had foreign ownership in 1999. Close to one third of the employees worked in a foreign-owned company in 1999 compared with each fifth in 1996. The value added – measured in value added in market prices for the foreign-owned large companies – was well over NOK 25 billion in 1999. This represented 44 per cent of value added for the large companies and 18 per cent of the entire manufacturing industry's value added.
Foreign ownership is defined as companies where the largest foreign owner controls directly or indirectly 50 per cent or more of the shares in the enterprise. The OECD defines foreign direct investments – as opposed to portfolio investments – as investments where the largest foreign owner controls at least 10 per cent of the share capital. The so-called minority-owned companies are defined as enterprises where the largest foreign shareholder controls between 10 and 50 per cent of the shares. The minority-owned companies represented 8 per cent of the production in Norwegian manufacturing, mining and quarrying, the majority-owned 28 per cent and the rest 64 per cent of the Norwegian-owned, where the foreign share is less than 10 per cent.
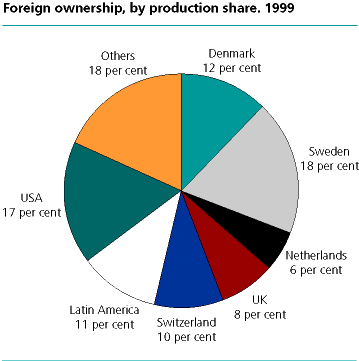
Sweden the largest owner
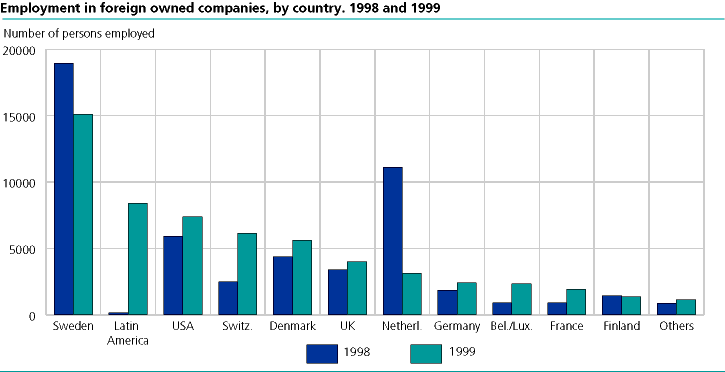
Sweden was decidedly the largest owner of Norwegian manufacturing measured by the number of companies and employment, and just ahead of the USA measured by production value. Even though the number of Swedish-owned companies declined somewhat from 1998 to 1999, every third foreign-owned company was still Swedish.
Among the owner countries – neighbouring countries like Denmark and Sweden dominated along with financial giants like the USA, Switzerland and the UK. In Swedish statistics on foreign ownership the same countries are the most important foreign owners. Otherwise Norway was the eight largest foreign owner in Sweden measured by employment, and the second largest measured by number of enterprises in 2000.
Most surprisingly – Latin America was the second largest foreign owner of Norwegian manufacturing measured by employment and the fourth largest measured by production in 1999 – after having been close to absent as an owner in the three previous years. Latin America also includes countries with rather favourable tax rules. It is important to realise that the concept that is used is the so-called direct owner, i.e. the country where the foreign company is registered – independent of whether this company is owned by a third country or Norway. Part of the Dutch decline as an owner country can be explained by the fact that enterprises have been transferred from the Netherlands to Latin America.
One out of four employees affected by foreign ownership
More than each fourth employee was in 1999 affected by foreign ownership because they worked for a company where the largest foreign owner controlled at least 10 per cent of the shares. The degree
of foreign influence, however, varied among manufacturing fields. Measured by the number of employees – most worked either in a foreign majority- or minority-owned company within the production of oil platforms, electronics and food industry.
Within paper manufacturing almost 70 per cent were employed in foreign majority- or minority-owned companies. Then followed the production of oil platforms and chemical manufacturing with shares of 50 and 46 per cent of the employees respectively.
High value added in foreign-owned companies
Value added measured by value added by employee was clearly highest in the foreign-owned companies, almost NOK 700,000 per employee, compared with NOK 400,000 for the Norwegian-owned. The picture was the same for the more homogenous group of large companies. The foreign-owned large companies had value added per employee of NOK 863,000 compared with NOK 470,000 for the Norwegian-owned. For most of the industries the value added per employee was higher for the foreign-owned companies, but for some it was lower like for instance paper manufacturing and within manufacturing of means of transport. Wages were also higher in the foreign-owned companies than in the Norwegian ones, more than NOK 80,000 more measured by total wage costs per employee. Care should however be taken when interpreting the results that foreign companies are more profitable and productive than the Norwegian ones due to ownership, because just profitability and productivity were reasons why these companies attracted foreign capital. In addition size and manufacturing differences are also factors that should be taken into consideration when making comparisons.
More foreign ownership in other countries
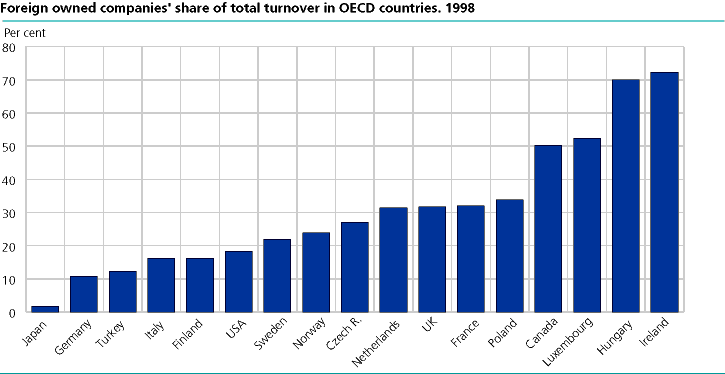
In an international perspective the part of foreign ownership in Norwegian manufacturing is not particularly high, even if it has been on the rise in recent years. The most recent data from the OECD show that Norway was number 10 among OECD-countries ranked according to foreign-owned companies' part of manufacturing turnover in 1998.
The foreign part in Norway of 24 per cent of the turnover in manufacturing was far behind countries like Ireland and Hungary where the figures were 72 and 70 per cent respectively. In large countries like Canada, France and the UK foreign ownership measured by turnover parts was considerable, Canada 50 per cent and France and the UK well over 30 per cent each. In the opposite end of the scale was Japan with a part of only 1.8 per cent. Furthermore, another large manufacturing big power, Germany, was on a relatively low level with a part of 10 per cent. In the USA foreign ownership represented as much as 18 per cent of the turnover in manufacturing.
Ranked by foreign-owned companies' part of employment in manufacturing, Norway was number 9 of 16 OECD-countries that supplied such information. The pattern is quite similar regarding turnover parts, while employment is by and large lower, something that indicates that the foreign-owned companies have higher turnover than the nationally owned ones. Furthermore, Ireland, Luxembourg and Hungary had the highest employment portions, 46, 46 and 45 per cent in foreign-owned companies.
Higher value added for foreign-owned enterprises also in the EU-countries
According to a newly published survey from Eurostat value added per employee was higher in foreign-owned manufacturing than in the nationally owned manufacturing companies in four comparable EU-countries – the same as was observed in Norwegian manufacturing.
For the nationally owned companies only the UK had a lower value added per employee than Norway, 46,000 ECU compared with 49,000 ECU in 1997. For foreign-owned companies in Norway value added per employee was 65,000 ECU or about 520,000 ECU in 1997, which were far lower than the foreign-owned manufacturing companies in the Netherlands with 85,000 ECU per employee. In the UK value added per employee was 70,000 ECU, in Finland the same as in Norway, whereas the foreign-owned companies in Sweden had less value added per employee than Norway and Finland. In Sweden, however, there was less difference in value added per employee between foreign and nationally owned companies.
Tables
Contact
-
Statistics Norway's Information Centre