Content
Published:
This is an archived release.
Marked increase in value of property sales
The aggregate value of properties transferred during the third quarter of 2012 increased by 12 per cent compared with the third quarter of 2011. The number of transferred properties rose by 2 per cent.
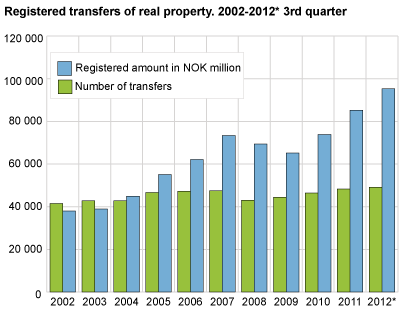
A total of 49 200 registered transfers of real property were recorded in the third quarter; an increase of 800 properties compared with the corresponding quarter last year. The aggregate value of properties transferred during the third quarter of 2012 amounted to NOK 95.3 billion. This is an increase of more than NOK 10 billion compared with the corresponding quarter in 2011.
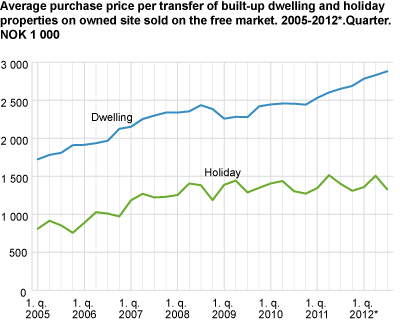
Growth in sales of dwellings
In the third quarter of 2012, a total of 25 300 dwellings were sold on the free market; an increase of 5 per cent compared with the same quarter in 2011. The average price per transfer was NOK 2.9 million.
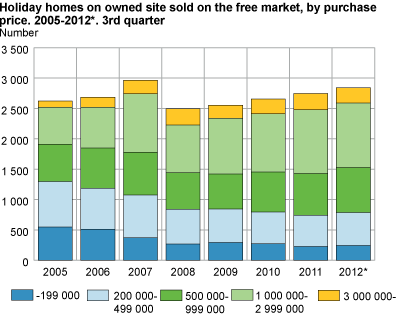
Small decrease for holiday homes
In total, 3 500 holiday homes were sold on the free market in the third quarter of 2012; a decrease of 1 per cent from the corresponding period in 2011. More than 2 800 of these were holiday homes on an owned site, while almost 700 were transfers of holiday homes on a leased site. The average price per transfer was NOK 1.3 million for holiday homes on an owned site, and NOK 1.2 million for holiday homes on a leased site.

What are the statistics about?The statistics are based on the number and the value of the registered transfers of real property. The composition of sold properties varies over time as regards size, standard and location. Due to this, the change in average price per transfer from one year to another does not reflect the correct price trend for a certain type of property. For instance, a large number of high-standard holiday homes have been built in recent years. Therefore, the average purchase price per transferred holiday home has increased more than the price of one single holiday home. The House price index shows the price trend for dwellings. Date of registration and date of saleThe statistics are based on the date of registration. This date can be several weeks and even months later than the date of sale. Free market saleFree market sale means that the property is sold for a price corresponding to the market value. The property is not always announced for sale on the free market. |
Tables:
- Table 1 Registered transfers of real property. 3rd quarter 2009-2012*
- Table 2 Registered transfers of real property, by quarter. 1999-2012*
- Table 3 Registered transfers of real property, by type of property. 3rd quarter 2009-2012*
- Table 4 Registered transfers of real property, by type of transfer and type of property. 3rd quarter 2012*
- Table 5 Transfer of dwelling properties with building, free market sale, by purchase price
- Table 6 Transfer of dwelling properties with building, free market sale, by type of dwelling
- Table 7 Transfers of holiday properties with building, free market sale
Additional information
The statistics are based on the date of registration. On average, a property is registered 30 days after the date of sale.
Contact
-
Terje Olav Rundtom
E-mail: terje.olav.rundtom@ssb.no
tel.: (+47) 91 38 60 61