Content
Published:
This is an archived release.
Increased property transfers
The number of registered transfers of dwellings and holiday homes rose by 7 and 8 per cent respectively from the fourth quarter of 2009 to the fourth quarter of 2010.
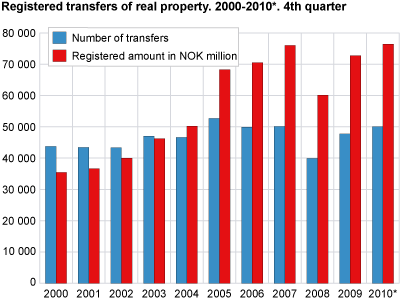
A total of 50 000 transfers of real property were registered in the fourth quarter of 2010; an increase of 2 300 properties compared with the corresponding quarter in 2009. The aggregate value of properties transferred during the fourth quarter of 2010 amounted to NOK 76.4 billion; an increase of 5 per cent compared with the corresponding quarter in 2008. This is the highest aggregate value registered during one quarter at any time.
Continued increase in transfers of dwellings
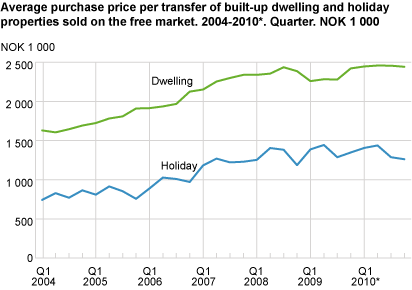
In the fourth quarter of 2010, a total of 22 250 dwellings were sold on the free market. The average price per transfer was NOK 2.4 million. One in four transferred dwellings had an average purchase price exceeding NOK 3 million. The highest average price per dwelling transfer in the fourth quarter of 2010 was recorded in Oslo with NOK 3.7 million.
Fewer high-priced holiday properties sold
A total of 2 600 holiday properties were sold on the free market in the fourth quarter of 2009, representing a 16 per cent increase from the same quarter last year. The average price per transfer was almost NOK 1.3 million. Compared with the corresponding quarter in 2009 the number of transferred holiday properties with a purchase price exceeding NOK 3 million deceased by 15 per cent. Transfers of holiday homes on leased sites are not included in these figures.
What are the statistics about?The statistics are based on the number and the value of the registered transfers of real property. The composition of sold properties varies over time as regards size, standard and location. Due to this, the change in average price per transfer from one year to another does not reflect the correct price trend for a certain type of property. For instance, a large number of high-standard holiday homes have been built in recent years. Therefore the average purchase price per transferred holiday home has increased more than the price of one single holiday home. The House price index shows the price trend for dwellings. Date of registration and date of saleThe statistics are based on the date of registration. This date can be several weeks or occasionally months later than the date of sale. Free market saleFree market sale means that the property is sold for a price corresponding to the market value. The property is not always announced for sale on the free market. |
Tables:
- Table 1 Registered transfers of real property. Year and 4th quarter 2009-2010*
- Table 2 Registered transfers of real property, by quarter. 1998-2010*
- Table 3 Registered transfers of real property, by type of property. Year and 4th quarter 2009-2010*
- Table 4 Registered transfers of real property, by type of transfer and type of property. 2010*
- Table 5 Transfer of dwelling properties with building, free market sale, by purchase price
- Table 6 Transfer of dwelling properties with building, free market sale, by type of dwelling
- Table 7 Transfers of holiday properties with building, free market sale, by purchase price
Additional information
The statistics are based on the date of registration. On average, a property is registered 30 days after the date of sale.
Contact
-
Terje Olav Rundtom
E-mail: terje.olav.rundtom@ssb.no
tel.: (+47) 91 38 60 61