Content
Published:
This is an archived release.
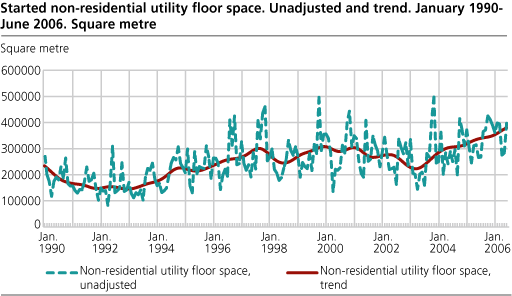
Building for industrial purposes increasing
The trend shows that the number of industrial buildings started has been increasing since 2003. Compared to the corresponding period in 2005, 18.1 per cent more utility space has been started during the first six months of this year.
The total number of new utility floor space in industrial buildings started during the first six months this year was 1 711 200 square metres. Most square metres is started in the industry group of buildings containing retail trade and repair of personal/household goods, with 92 800 square metres of utility space only in June. During the first half of this year a total of 443 600 square metres of utility space was started in this group.
The largest growth in utility floor space is recorded in the industry group containing real estate, renting and business activities. The 219 800 square metres started during the first six months of 2006 resulted in a 108.3 per cent increase in this group compared to the corresponding period last year.
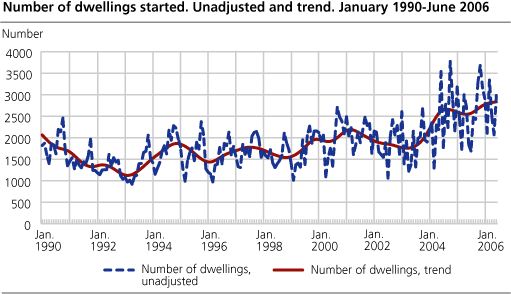
Number of new dwellings still high
The total number of dwelling-starts in the first six months of this year amounted to 15 899. This resulted in a 6.6 per cent increase in the number of new dwellings in the first half of this year, compared to the corresponding period last year.
Tables:
- Table 1 Building work started. Preliminary figures
- Table 2 Building activity in June. Preliminary figures
- Table 3 Building work started in January-June, by county. Preliminary figures
- Table 4 Buildings under conctruction per 30 June, by county. Preliminary figures
- Table 5 Buildings completed in January-June, by county. Preliminary figures
- Table 6 Building work started. Not adjusted, seasonally adjusted and trend
- Table 7 Building work started in June. County. Preliminary figures
- Table 8 Buildings permits in June. Preliminary figures. Breakdown according to Eurostat classifications
- Table 9 Average monthly registration delay for buildings started. January 2003-June 2006
Contact
-
Jens Mathiesen
E-mail: jens.mathiesen@ssb.no
tel.: (+47) 40 81 13 98
-
Magnus Espeland
E-mail: magnus.espeland@ssb.no
tel.: (+47) 45 27 40 08