Content
Published:
This is an archived release.
New figures for population changes in municipalities
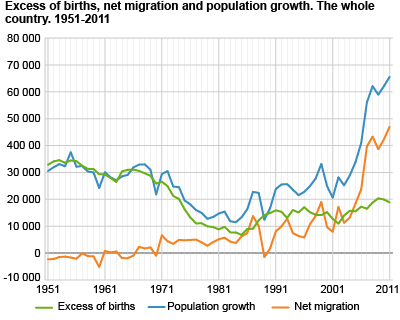
The historical overview of population changes in each municipality after 1950 is now updated with figures up to 2012. Earlier the population growth in Norway was almost entirely due to the excess of births, but today the increase is mostly due to in-migration from abroad.
The tables for the municipalities show yearly figures for population, increase in population, excess of births, net migration, in-migrations and out-migrations for the whole country, the counties and the municipalities.
Since 1970, population growth in Norway has increasingly been linked to the increasing influx of foreign citizens. When Norway had slightly more out-migration than in-migration in the 1950s and 1960s, the large post-war cohorts caused the population to increase. Today the situation is different; the in-migration is higher than the out-migration and is the main reason for the high population growth.
Population increasing rapidly
In 2011, 72 per cent of the population growth was a result of net migration, and thus contributed to more than double the excess of births. Population growth is now among the highest in Europe. After a dramatic fall in birth rates throughout the 1970s and low birth rates in the early 1980s, the excess of birth decreased and we had a flattening of the growth. This situation changed rapidly from the second half of the 1980s. Except for a small decline at the end of this decade, in-migration has increased significantly.
Geographical variations
The population changes in the counties and in some municipalities may diverge a lot from the average in the whole country. There may be factors other than demographic reasons, such as decisions on regional development, power development, location of asylum centres, etc. In addition, figures for municipalities often vary from one year to another due to chance.
Today the population is increasing in all the counties. Many municipalities in the north and the west have been losing inhabitants to other parts of the country for decades, since at least 1950. In recent years, however, there has been a population growth in all parts of the country, as a result of in-migration from abroad. While the population increased in 53 per cent of the 744 municipalities in 1951, the corresponding figures were 73 per cent in the 430 municipalities in 2011. Looking at the relation between births and deaths, there was an excess of deaths over births in 47 per cent of the municipalities in 2011, while the corresponding figure for 1951 was only 2 per cent.
The time series shows that all the four largest cities have been growing substantially in recent decades. With unchanged municipal boundaries, the population since 1 January 1972 increased the least in Bergen and Oslo, 24 and 29 per cent respectively. In Trondheim, the growth was 37 per cent and in Stavanger 55 per cent. Furthermore, it appears that in this 40-year period, both Bergen and Oslo's population were at their lowest in 1984, and their population growth since 1984 has been 27 and 37 per cent respectively.
Changes in municipal boundaries cause complications
The figures in the tables dating back to 1951 relate to the municipal borders existing at any time. The numerous and often extensive local regulations in the period, particularly in the 1960s, make comparisons over time difficult in many municipalities, especially of the population and totals, such as the numbers of births, deaths, in-migrations and out-migrations. Breaks in the series are marked in the tables, and information about boundary changes and population in the merged or transferred areas are given.
Tables
The statistics is published with Population.
Contact
-
Statistics Norway's Information Centre
E-mail: informasjon@ssb.no
tel.: (+47) 21 09 46 42

