Content
Published:
This is an archived release.
60 years of population growth
The historical overview of population changes in Norwegian municipalities from 1951 has been updated with population changes in 2010 and resident population as of 1 January 2011.
It has become easier to study population changes in individual municipalities by using the historical statistics series with annual figures on population, population growth, excess of births over deaths, net migration, births, deaths, in-migration and out-migration.
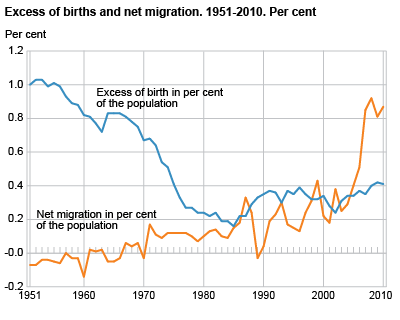
Excess of birth has been replaced by net migration
Last year the population in Norway grew, in absolute figures, more than twice as much as in 1951. While the population increased by 30 500 persons in 1951, the figure was 62 100 in 2010.
The reason for the population growth today is different to previous years. While the population growth in this country in the 1950s was caused by the birth surplus, it is nowadays the net immigration that is the main reason, and makes up more than two-thirds of the growth.
In the early 1950s, the birth surplus on an annual basis was about 1 per cent of the population. This surplus decreased during the following decades and reached its lowest point in 1985, with only 0.2 per cent of the population. In the 1950s and the 1960s there was an emigration surplus. Since then, there has, with some exceptions, been an increasing immigration surplus. The immigration has been particularly high the last four years.
Over the past 10 years, there has been a significant population growth in all the major cities; Oslo, Stavanger, Bergen and Trondheim. In Oslo, population growth calculated in relation to the population at the beginning of the year increased from 0.8 per cent in 2001 to 2.1 per cent in 2010, and in Stavanger the corresponding figures were 0.8 and 1.8 per cent. The increase has been slightly weaker in Bergen and Trondheim.
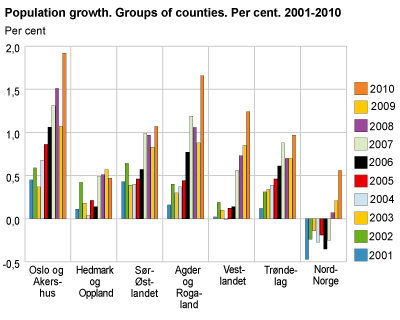
Population growth in almost all parts of the country over the last decade
The population grew in almost all parts of the country over the last decade and this is mainly due to increased immigration. Northern Norway turned negative to positive in 2008. Oslo and Akershus had the highest growth in the period, closely followed by Agder and Rogaland. Neither of the counties Hedmark and Oppland showed any marked growth in this period.
Boundary changesThe figures presented in this article are applicable for the municipal boundaries in effect at the indicated time. The numerous and extensive redrawings of municipal boundaries during the period, particularly in the 1960s, make comparisons over time difficult in a number of municipalities. Because no figures exist for births, deaths and migration for areas smaller than whole municipalities, no attempts have been made in this publication to compute time series for current municipal units previously affected by boundary changes. Breaks in the number series are marked in the tables, and information about boundary changes and population in transferred areas is given. |
The statistics is published with Population.
Contact
-
Statistics Norway's Information Centre
E-mail: informasjon@ssb.no
tel.: (+47) 21 09 46 42