Content
Published:
This is an archived release.
Population development 1951-2009
The historical overview of population changes in Norwegian municipalities from 1951 has been updated with population changes in 2008 and resident population as of 1 January 2009.
It has become easier to study population changes in individual municipalities by using the historical statistics series with annual figures on population, population growth, excess of births over deaths, net migration, births, deaths, in-migration and out-migration.
Various reasons for growth
Long time series with annual figures for each municipality provide a retrospective look at periods with changing conditions for growth and development, making development trends more distinct. Population trends are presented and population growth and decline can be studied, including breakdowns by excess of births over deaths and migration balance. The time series reveal whether a higher excess of births over deaths is due to more births or fewer deaths, and whether less favourable migration balances are due to a decline in in-migration or an increase in out-migration.
What the figures show
The historical material for the municipalities shows how, for several decades since 1950, a large number of municipalities in the northern and western parts of Norway have experienced a net loss in population to the rest of Norway. At times, the net loss has been as high as or higher than in the last couple of decades, but many municipalities have nevertheless had a considerable population growth due to high birth figures. However, when the number of births fell considerably in all parts of the country in the 1970s, the excess of births over deaths became too small to compensate for out-migration. In the 1980s, the number of births increased, but this was primarily in the central parts of the country.
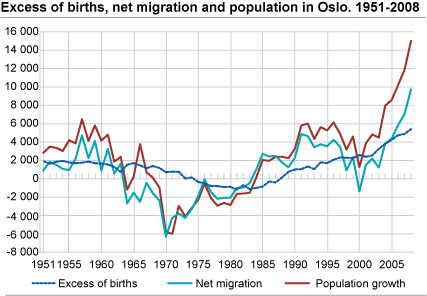
The time series for the city of Oslo, whose boundaries have remained virtually unchanged since 1950, show that population growth has fluctuated considerably over these years. The population has increased by 32 per cent in this period. In the same period, the population in the whole country has increased by 46 per cent. The direction and strength of the migration flows have changed. Birth numbers have peaked in recent years (in absolute numbers), and the capital now experiences a solid excess of births over deaths compared with the early 1980s, when there was a considerable deficit.
Boundary changes
The figures presented in this article apply to the municipal boundaries in effect at the indicated time. The numerous and extensive redrawings of municipal boundaries during the period, particularly in the 1960s, make comparisons over time difficult in a number of municipalities. Because no figures exist for births, deaths and migration for areas smaller than whole municipalities, no attempts have been made in this publication to compute time series for current municipal units previously affected by boundary changes. Breaks in the number series are marked in the tables and information about boundary changes and population in transferred areas is given.
Useful Excel tables
Many of Norway's 430 municipalities (1 January 2009) are composed of several former municipalities, for instance Kristiansund, Vindafjord, Aure and Bodø. As the available Excel tables also include more than 300 separate tables for municipalities that no longer exist, a number of exact or approximate figures for current municipal units can be made. Most county figures are comparable, as the counties have been affected very little by boundary changes during the period.
The statistics is published with Population.
Contact
-
Statistics Norway's Information Centre
E-mail: informasjon@ssb.no
tel.: (+47) 21 09 46 42